
|
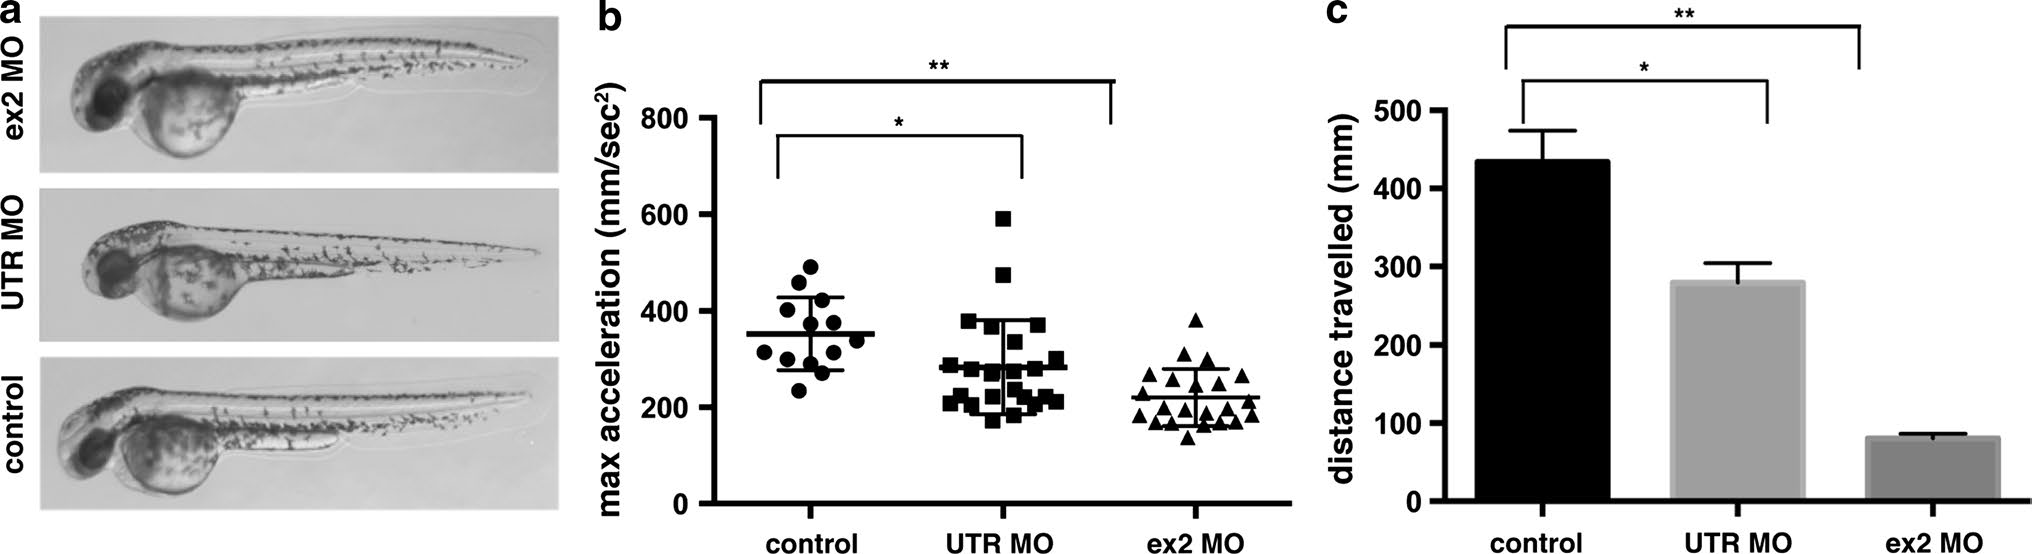
Fig. 11
Functional analysis of Actc1b knockdown in zebrafish. a Brightfield images of wild-type embryos injected with actc1b targeting morpholinos (MO) compared to control uninjected embryos. b Quantification of the maximum acceleration recorded from touch-evoked response assays of Actc1b morphants compared to control zebrafish at 2 dpf. Error bars represent SEM for three replicate experiments (20 fish per replicate), **p < 0.01. c Quantification of the distance traveled by Actc1b morphants compared to control zebrafish at 6 dpf. Error bars represent �SEM for three replicate experiments (n = 48 per experiment), **p < 0.01