
Image
|
Figure Caption
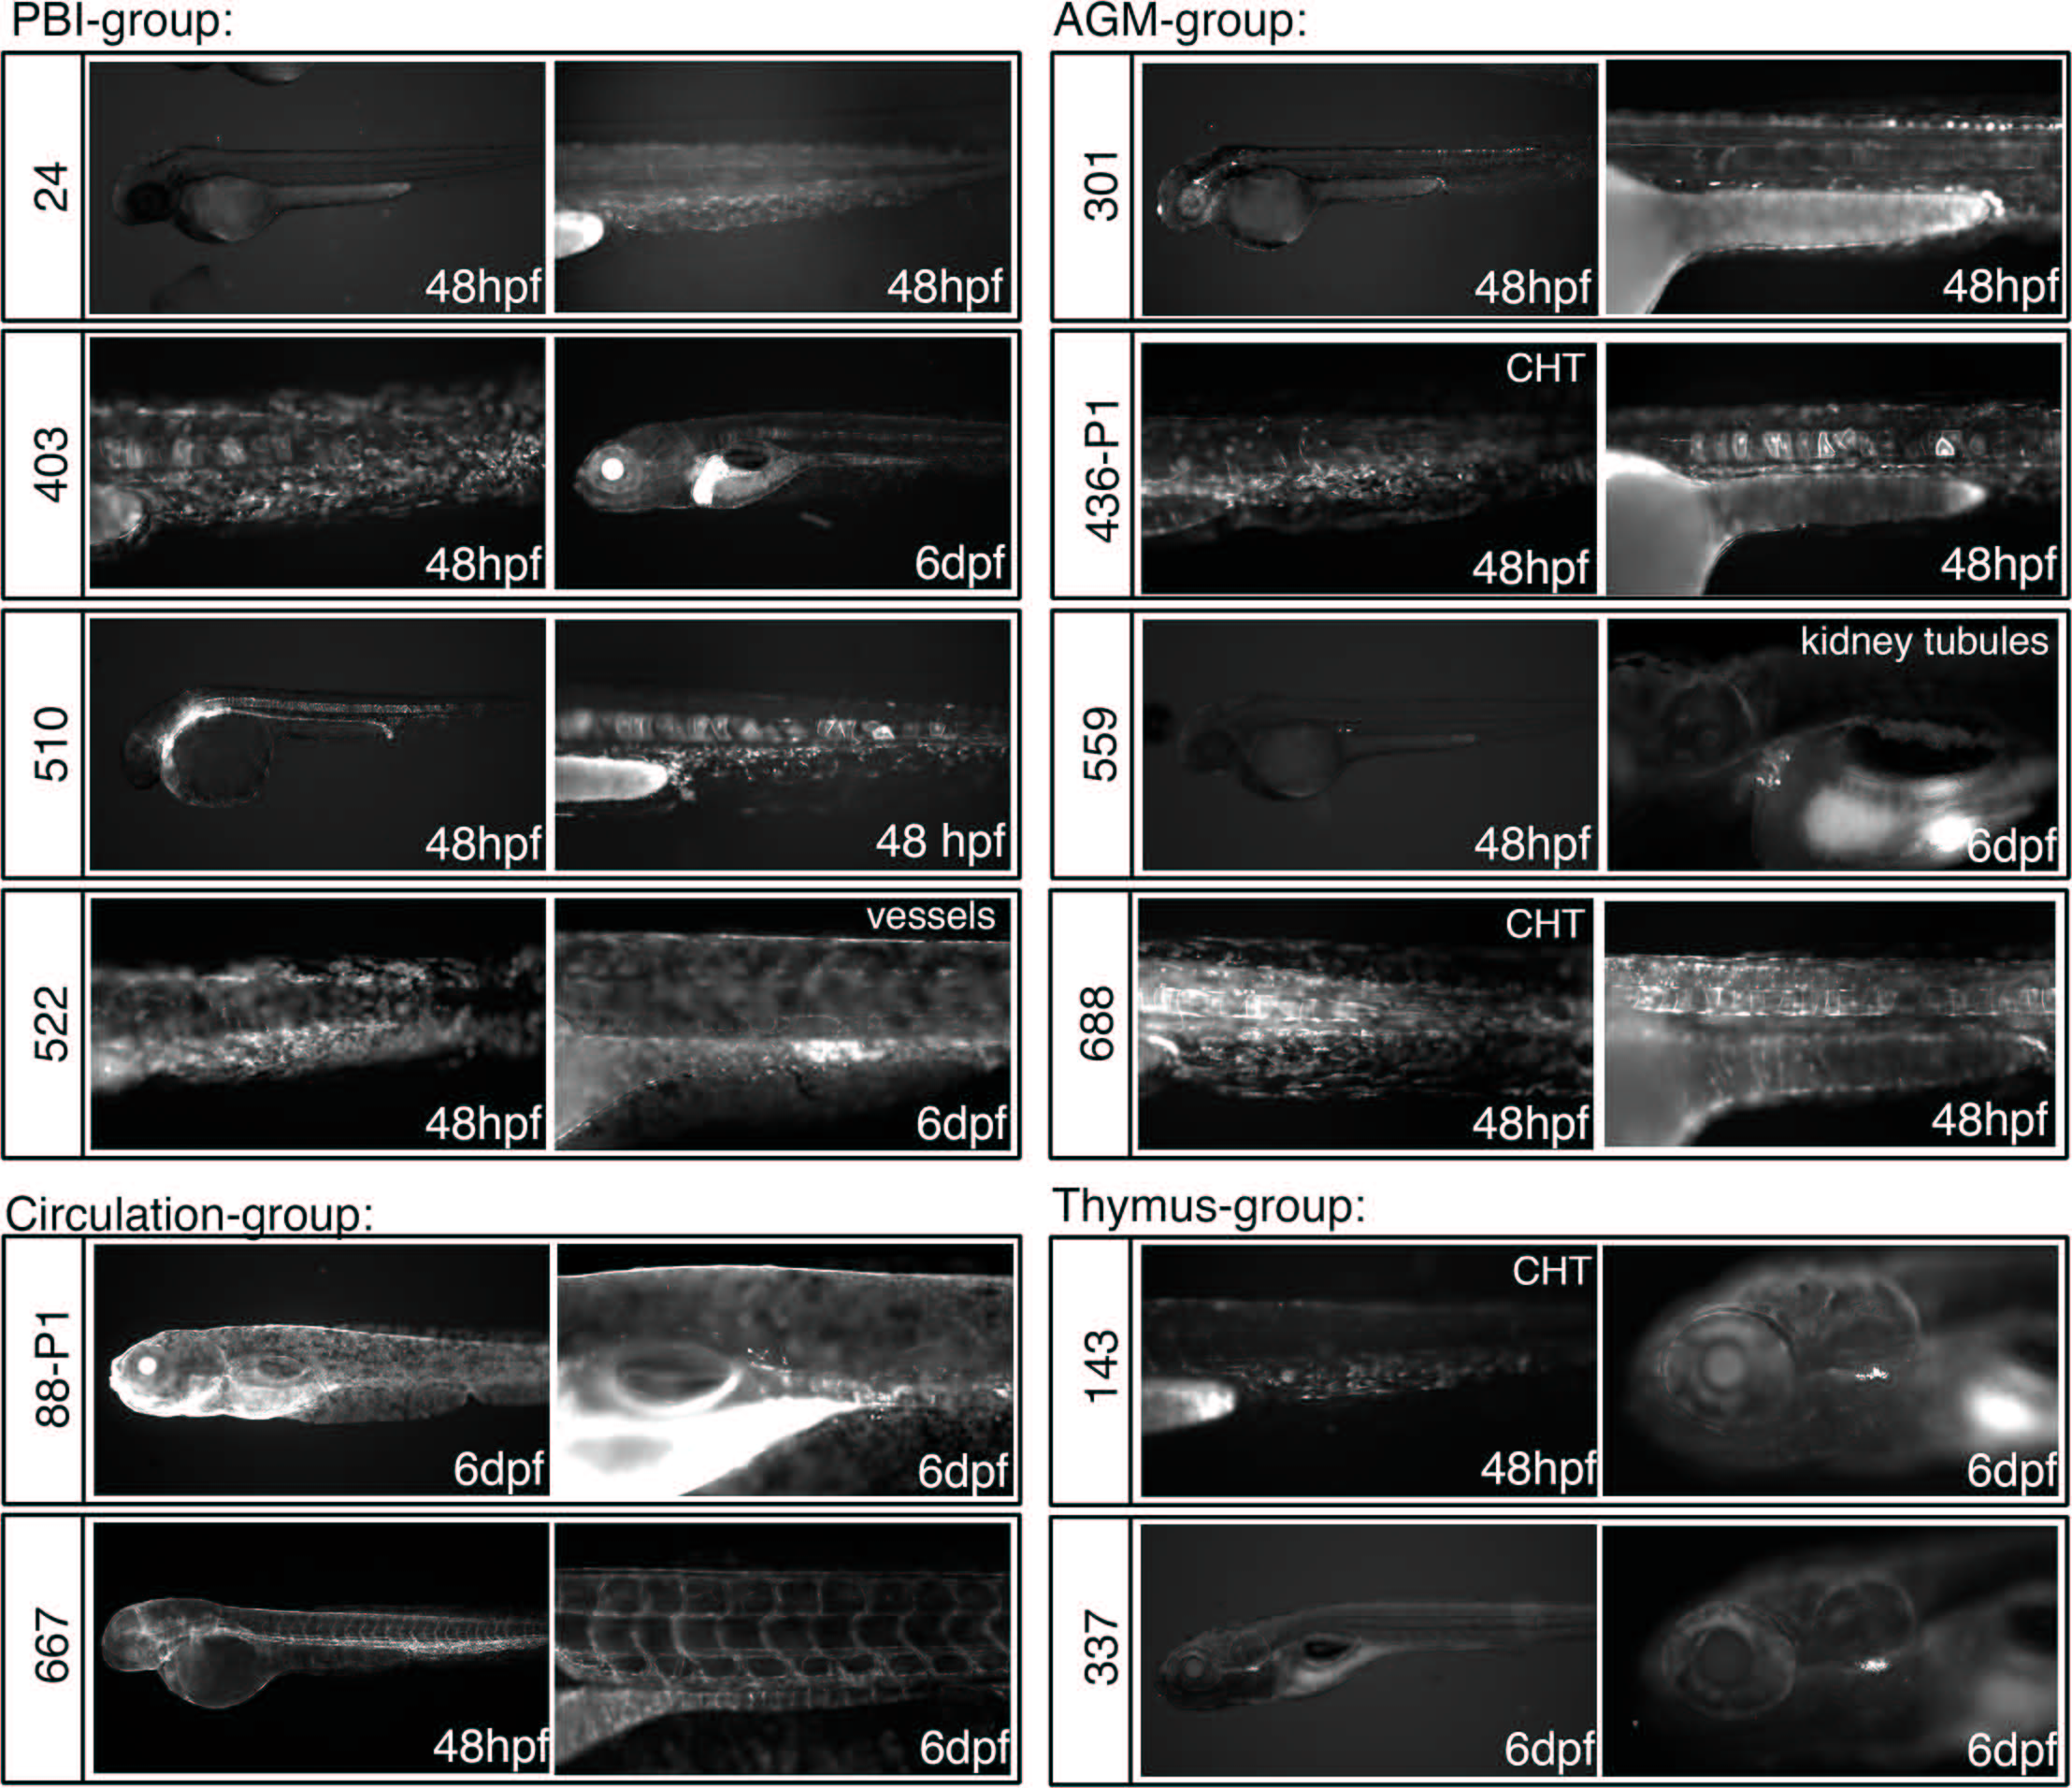
Fig. 2 Patterns of GFP expression in GBT-B4 gene trap lines that include hematopoietic tissues.
Lateral views of embryos at 48 hpf or 6 dpf are shown. The Tg(GBT-B4)fcc line number is indicated to the left of the panels. The embryo age is indicated. CHT = caudal hematopoietic tissue; AGM = aorta-gonad-mesonephros. Note that the lines are grouped by hematopoietic expression patterns, but the embryos can express GFP in additional tissues.
Figure Data
Acknowledgments
This image is the copyrighted work of the attributed author or publisher, and
ZFIN has permission only to display this image to its users.
Additional permissions should be obtained from the applicable author or publisher of the image.
Full text @ PLoS One