
|
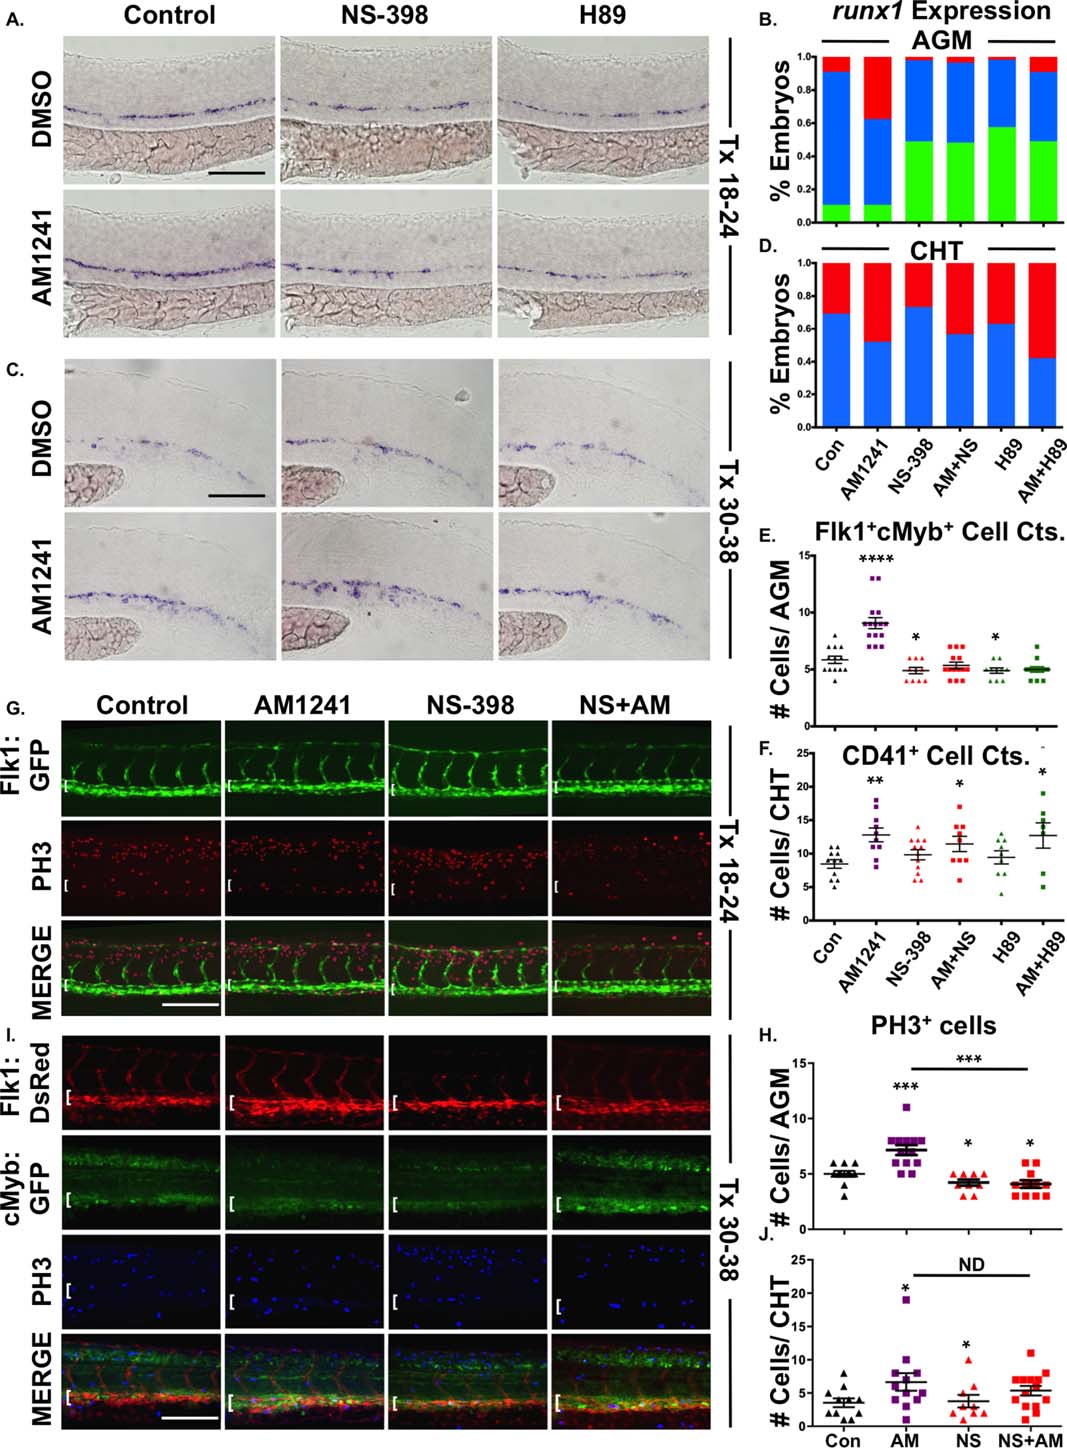
Fig. 5
AM1241 mediates hematopoietic stem cell (HSC) expansion in the AGM, but not CHT, via PGE2-signaling.
(A): Treatment with selective inhibitors to Ptgs2 (NS-398) or PKA/cAMP (H89, 5 �M) during niche specification (18?24 hpf) decreased runx1 expression and blocked AM1241-mediated inductions in hematopoietic stem and progenitor cell (HSPC) expression in the AGM (n e 45 per condition).
(B): Qualitative phenotypic distribution of embryos from panel (A), scored with low, medium, or high runx1 expression in the AGM.
(C): Treatment with NS-398 or H89 during hematopoietic stem cell (HSC) production (30?38 hpf) failed to block AM1241-mediated elevations in runx1;cmyb expression in the CHT (n e 75 per condition).
(D): Qualitative phenotypic distribution of embryos from panel (C), scored with low, medium, or high runx1 expression in the CHT.
(E): Absolute counts of Flk1:dsRed+;cMyb:GFP+ HSCs confirmed PGE2 production and signaling are required to mediate the effects of AM1241 in the AGM (DMSO: 5.8 � 0.3, AM1241: 9.1 � 0.5, NS-398: 4.9 � 0.3, AM1241+NS-398: 5.4 � 0.3, H89: 4.9 � 0.2, AM1241+NS-398: 5.0 � 0.2; *, p d .05; ****, p < .0001, two-tailed t test, n e 10 per condition).
(F): Absolute counts of CD41:GFP+ HSCs confirmed AM1241-mediated increases in the CHT are independent of PGE2 production and signaling (DMSO: 8.5 � 0.6, AM1241: 12.8 � 1, NS-398: 9.8 � 0.8, AM1241+NS-398: 11.4 � 1.1, H89: 9.4 � 1.0, AM1241+NS-398: 12.7 � 1.9, *, p d .05; **, p d .01, two-tailed t test, n e 9 per condition).
(G): Embryos exposed to AM1241 during niche specification (18?24 hpf) exhibited an increased number of pH3+ (red) cells in the Flk1:GFP+ hemogenic vasculature of the AGM (dorsal aorta marked with white bracket) at 30 hpf, which was blocked by cotreatment with NS-398 (n e 9 per condition).
(H): Absolute counts of pH3+ cells in the AGM, as described in panel (G) (DMSO: 5.0 � 0.27, NS-398: 4.22 � 0.28, AM1241: 7.15 � 0.45, AM1241+NS-398: 4.09 � 0.34; *, p d .05; ***, p d .001, two-tailed t test).
(I): Embryos exposed to AM1241 during HSC production (30?38 hpf) exhibited a higher number of pH3+ (blue) cMyb:GFP+ HSPCs in the Flk1:dsRed vasculature of the CHT (CHT width marked with white bracket) at 38 hpf; this effect was independent of Ptgs2 activity (n e 9 per condition).
(J): Absolute counts of cMyb:GFP+;pH3+ cells in the CHT, as described in panel (I) (DMSO: 3.55 � 0.57, NS-398: 3.78 � 0.94, AM1241: 6.67 � 1.33, AM1241+NS-398: 5.36 � 0.72; *, p < .05, two-tailed t test). Scale bars (A, C) = 80 �m, (G, I) = 100 �m. Abbreviations: AGM, aorta-gonad-mesonephros; CHT, caudal hematopoietic tissue; DMSO, Dimethyl Sulfoxide; GFP, green fluorescent protein; PH3, phospho-histone 3.