
|
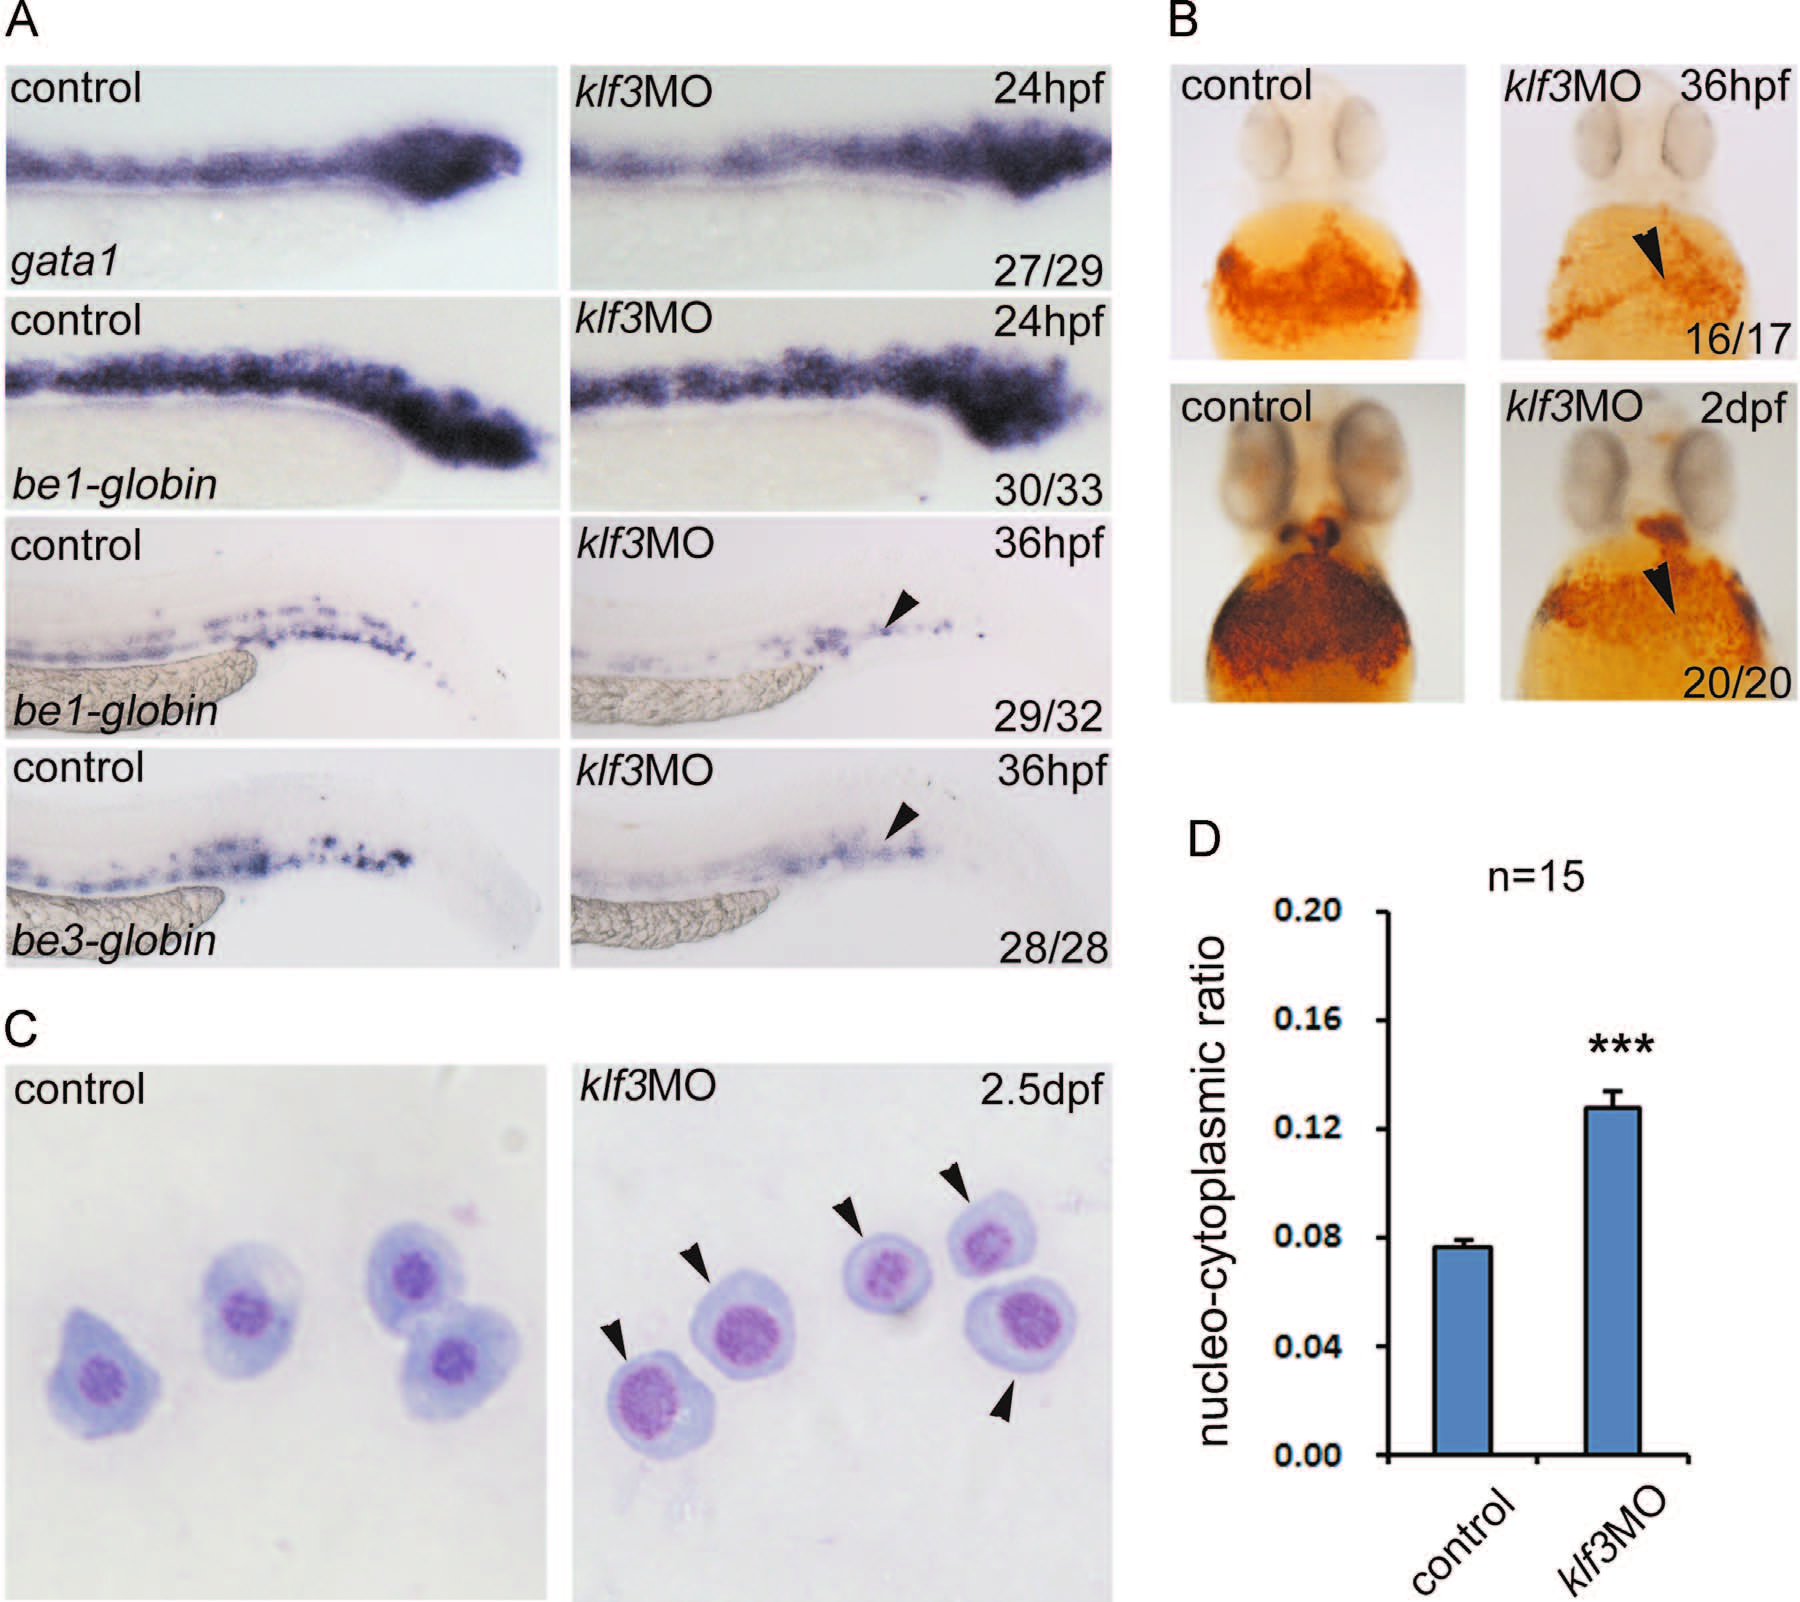
Fig. 3
Maturation of erythrocytes was blocked inklf3 morphants. (A) The expressions of gata1 and be1-globin did not change in klf3 morphants at 24 hpf. However, the expressions of be1-globin and be3-globin were remarkably decreased during the differentiation and maturation of blood red cells at 36 hpf. The arrowheads mark RBCs in CHT. (B) O-dianisidine staining of hemoglobin during erythropoiesis. At 36 hpf and 2 dpf, the staining in klf3 morphants was significantly reduced, indicating that the maturation of RBCs was blocked. The RBCs in the heart region are indicated by arrowheads. (C) Blood-smear and Giemsa staining. At 2.5 dpf, the size and nucleo-cytoplasmic ratio of RBCs from klf3 morphants were increased compared with those of controls, indicating the arrest of erythroid cell maturation. The arrowhead marks the delayed erythroid progenitor. (D) Quantification of the nucleo-cytoplasmic ratio between controls and klf3 morphants (mean�SD, ***P <0.001, n=15). The nucleo-cytoplasmic ratio was calculated as follows: the diameter of nucleus (D1) and whole cell (D2) were measured by Photoshop, and the nucleo-cytoplasmic ratio (NCR) was calculated using formula ![]() . Each sample contains 15 cells in controls and morphants.
. Each sample contains 15 cells in controls and morphants.
Reprinted from Developmental Biology, 403(2), Xue, Y., Gao, S., Liu, F., Genome-wide Analysis of the Zebrafish Klf Family Identifies Two Genes important for Erythroid Maturation, 115-27, Copyright (2015) with permission from Elsevier. Full text @ Dev. Biol.