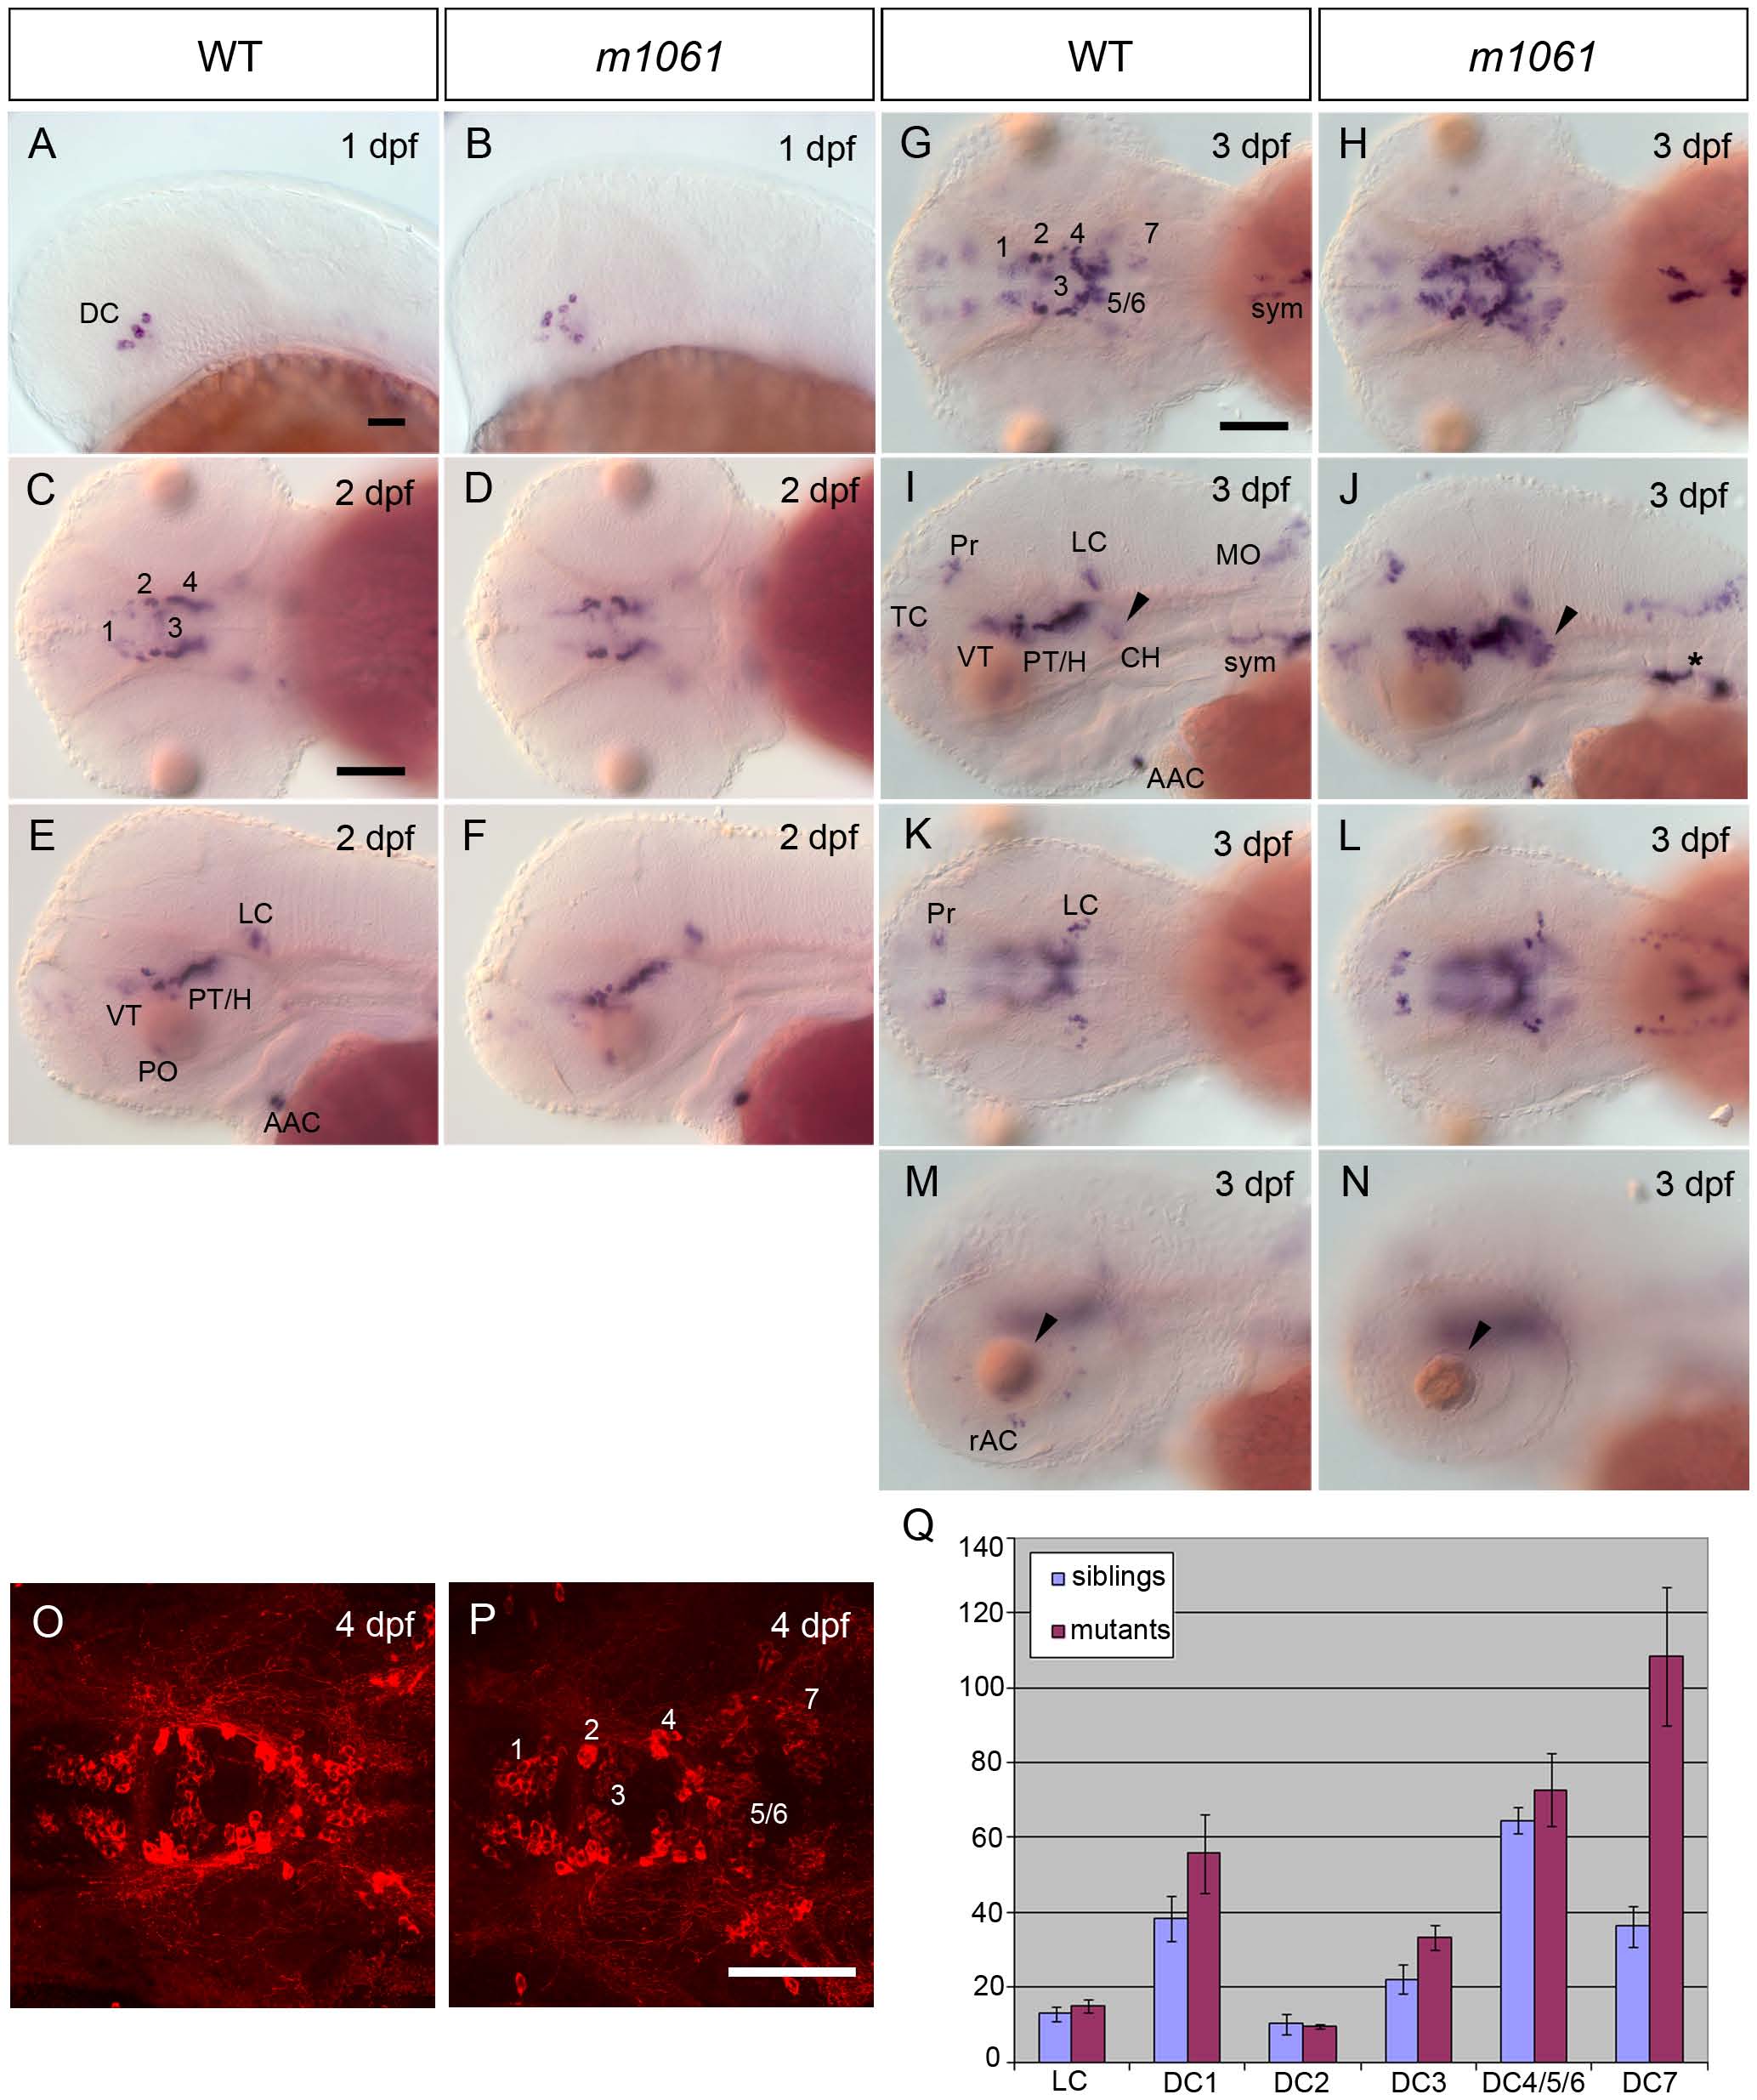
Fig. 1 m1061 mutants show increased th expression and increase in number of hypothalamic DA neurons from 3 dpf onwards.
Analysis of th gene expression in cnot8m1061 mutants and WT siblings as indicated in header. (A–F) th transcript levels are not altered in m1061/m1061 mutants at 1 and 2 dpf. Embryos were genotyped by PCR. (G–N) m1061 mutants at 3 dpf display stronger WISH signal indicating increased th mRNA levels in DA groups 1 to 7 (arrowhead) and NA sympathetic cells (asterisk). (K, L) NA locus coeruleus (LC) and DA pretectal cells (Pre) do not display altered th expression levels in m1061 mutant embryos. (M, N) The number of DA retinal amacrine cells (rAC) is reduced in m1061 mutant embryos. Additionally m1061 mutants display a lens defect (arrowheads). Genotypes were inferred by th WISH analysis. (O, P) anti-TH immunohistochemistry of m1061 mutant embryo and WT sibling at 4 dpf document DA neurons in the ventral diencephalon. Data confirm a higher cell number of DC7 DA neurons in the caudal hypothalamus of m1061 mutants. Dorsal view z-projections of partial confocal stacks representing the ventral diencephalon are shown. (A, B, E, F, G, H, M, N) lateral views, anterior at left; (C, D, G, H, K.L, O, P) dorsal views, anterior at left. Scale bars 100 µm in A for A, B; in C for C–F; in G for G–N; in P for O, P. Abbreviations: DC - early diencephalic DA group (DC2, DC4), 1 - ventral thalamic DA group, 2,4,5,6 posterior tubercular and hypothalamic Orthopedia-dependent DA groups, 3 - medial hypothalamic DA group, 7 - caudal hypothalamic DA group, VT - ventral thalamus, PT/H - posterior tuberculum/hypothalamus, PO - preoptic area, AAC - arch associated catecholaminergic neurons/carotid body, sym - sympathetic NA neurons, Pr - pretectum, TC - telencephalon, CH - caudal hypothalamus, LC locus coeruleus, MO - medulla oblongata, rAC - retinal amacrine cells. (Q) Quantification of CA cell numbers in m1061 embryos at 4 dpf. Cell counts of DC1-7 and LC TH-expressing cells. Bars show the average number of CA neurons in five m1061 mutants and five WT sibling embryos. Error bars indicate standard deviation. Significance was evaluated using Mann-Whitney test (see text and Table S1).

