
Image
|
Figure Caption
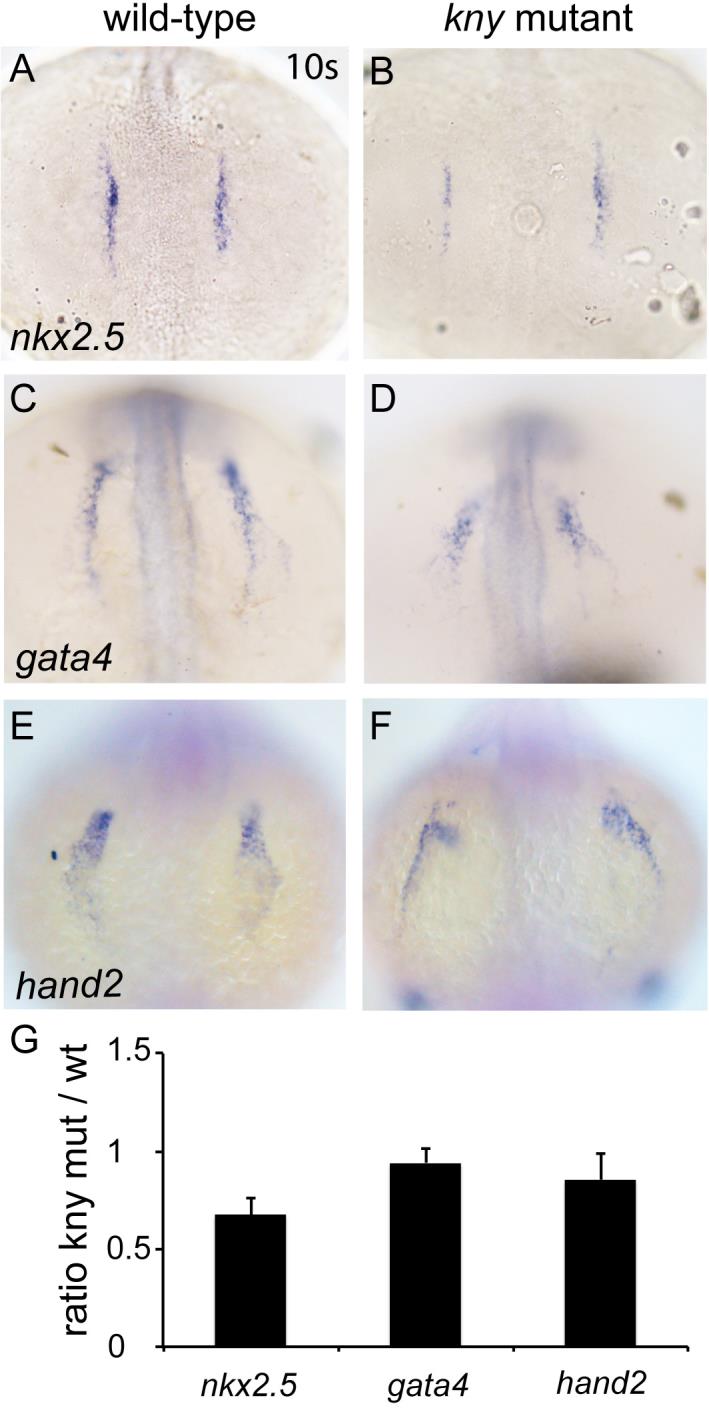
Fig. S4
Related to Figure 2: Cardiac specification in kny/gpc4 mutants. (A-F) Dorsal view of wild-types (A,C,E) and kny/gpc4 mutants (B,D,F) at 10-somite stage. In situ hybridization was carried out for nkx2.5 (A and B), gata4 (C and D) and hand2 (E and F). (G) qPCR results of embryos from corresponding stages. Gene expression levels were normalized against ef1a. The y-axis represents the ratio of expression levels between kny/gpc4 mutants and wild-type siblings (three biological repeats). Results are represented as mean±s.e.m.
Acknowledgments
This image is the copyrighted work of the attributed author or publisher, and
ZFIN has permission only to display this image to its users.
Additional permissions should be obtained from the applicable author or publisher of the image.
Full text @ Development