
|
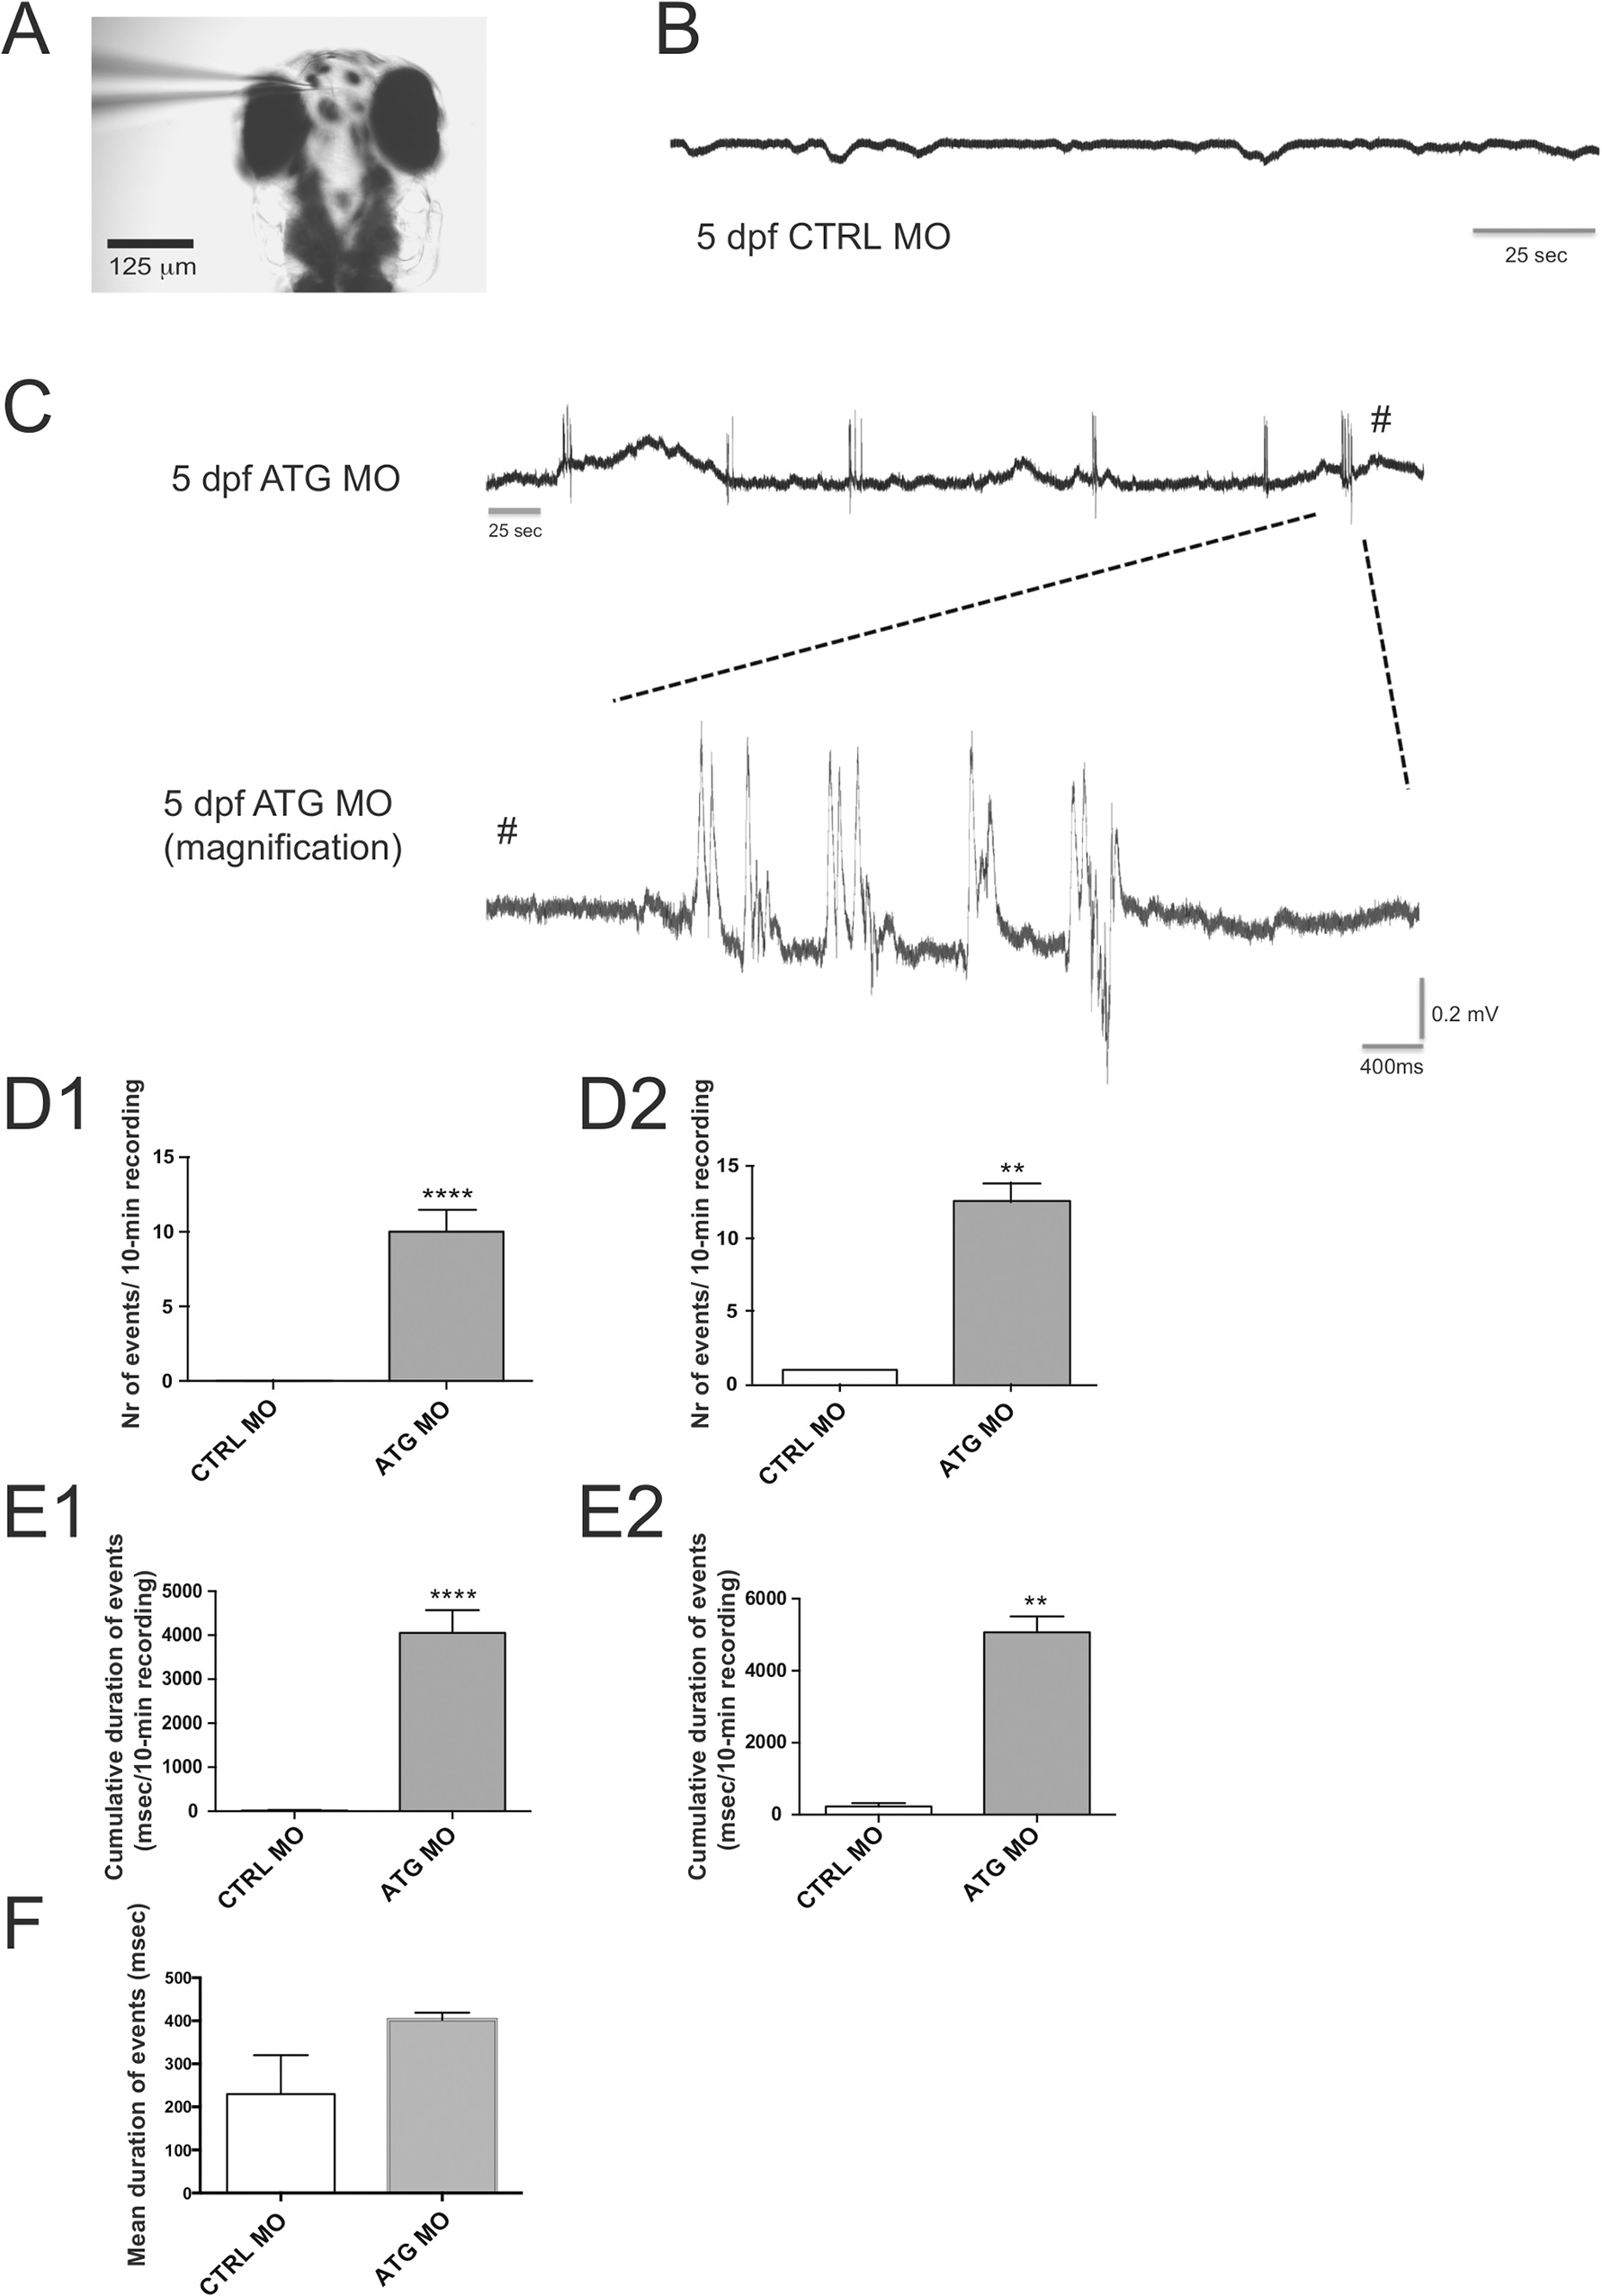
Fig. 3
Spontaneous electrographic activity recorded from 5 dpf ATG MO- and CTRL MO-injected larvae.
(A) Representative recording configuration of an agar-immobilized zebrafish at 5 dpf. Note the recording electrode placed in the forebrain. (B) Extracellular recordings from the forebrain of 5 dpf CTRL-MO larvae. (C) Representative epileptiform activities of 5 dpf ATG MO-injected larvae displaying polyspiking discharges. Top trace represents a typical epileptiform pattern as seen in gap-free recordings. Bottom trace shows high-resolution magnification of epileptiform events mentioned above. (D) Occurrence of epileptiform events in CTRL MO- and ATG MO-injected larvae. (D1) All larvae: CTRL MO 0.07�0.05 vs ATG MO 10.03�1.38 events/recording (n = 28 and 30 larvae, respectively). (D2) Seizure-positive larvae: CTRL MO 1.0�0.0 vs ATG MO 12.54�1.27 events/recording (n = 2 and 24 larvae, 2 and 302 events analyzed, respectively). (E) Cumulative duration of epileptiform events in CTRL MO- and ATG MO-injected larvae. (E1) All larvae: CTRL MO 16.4�12.3 vs ATG MO 4053�515 msec/10 min-recording (n = 28 and 30 larvae, respectively). (E2) Seizure-positive larvae: CTRL MO 290�91 vs ATG MO 5066�441 events/recording (n = 2 and 24 larvae, respectively). (F) Mean duration of electrographic activity recorded from 5 dpf CTRL MO- and ATG MO-injected larvae. ATG MO, 402.6�16.4 vs CTRL MO 230�91 msec (n = 302 and 2 events from 30 and 2 larvae, respectively, P = 0.3929). Statistical analysis was performed using Student?s unpaired t-test or Mann?Whitney test for data that failed the normality test, as appropriate. Error bars on all graphs represent standard error of mean (SEM). ** P d 0.01, **** Pd0.0001.