
|
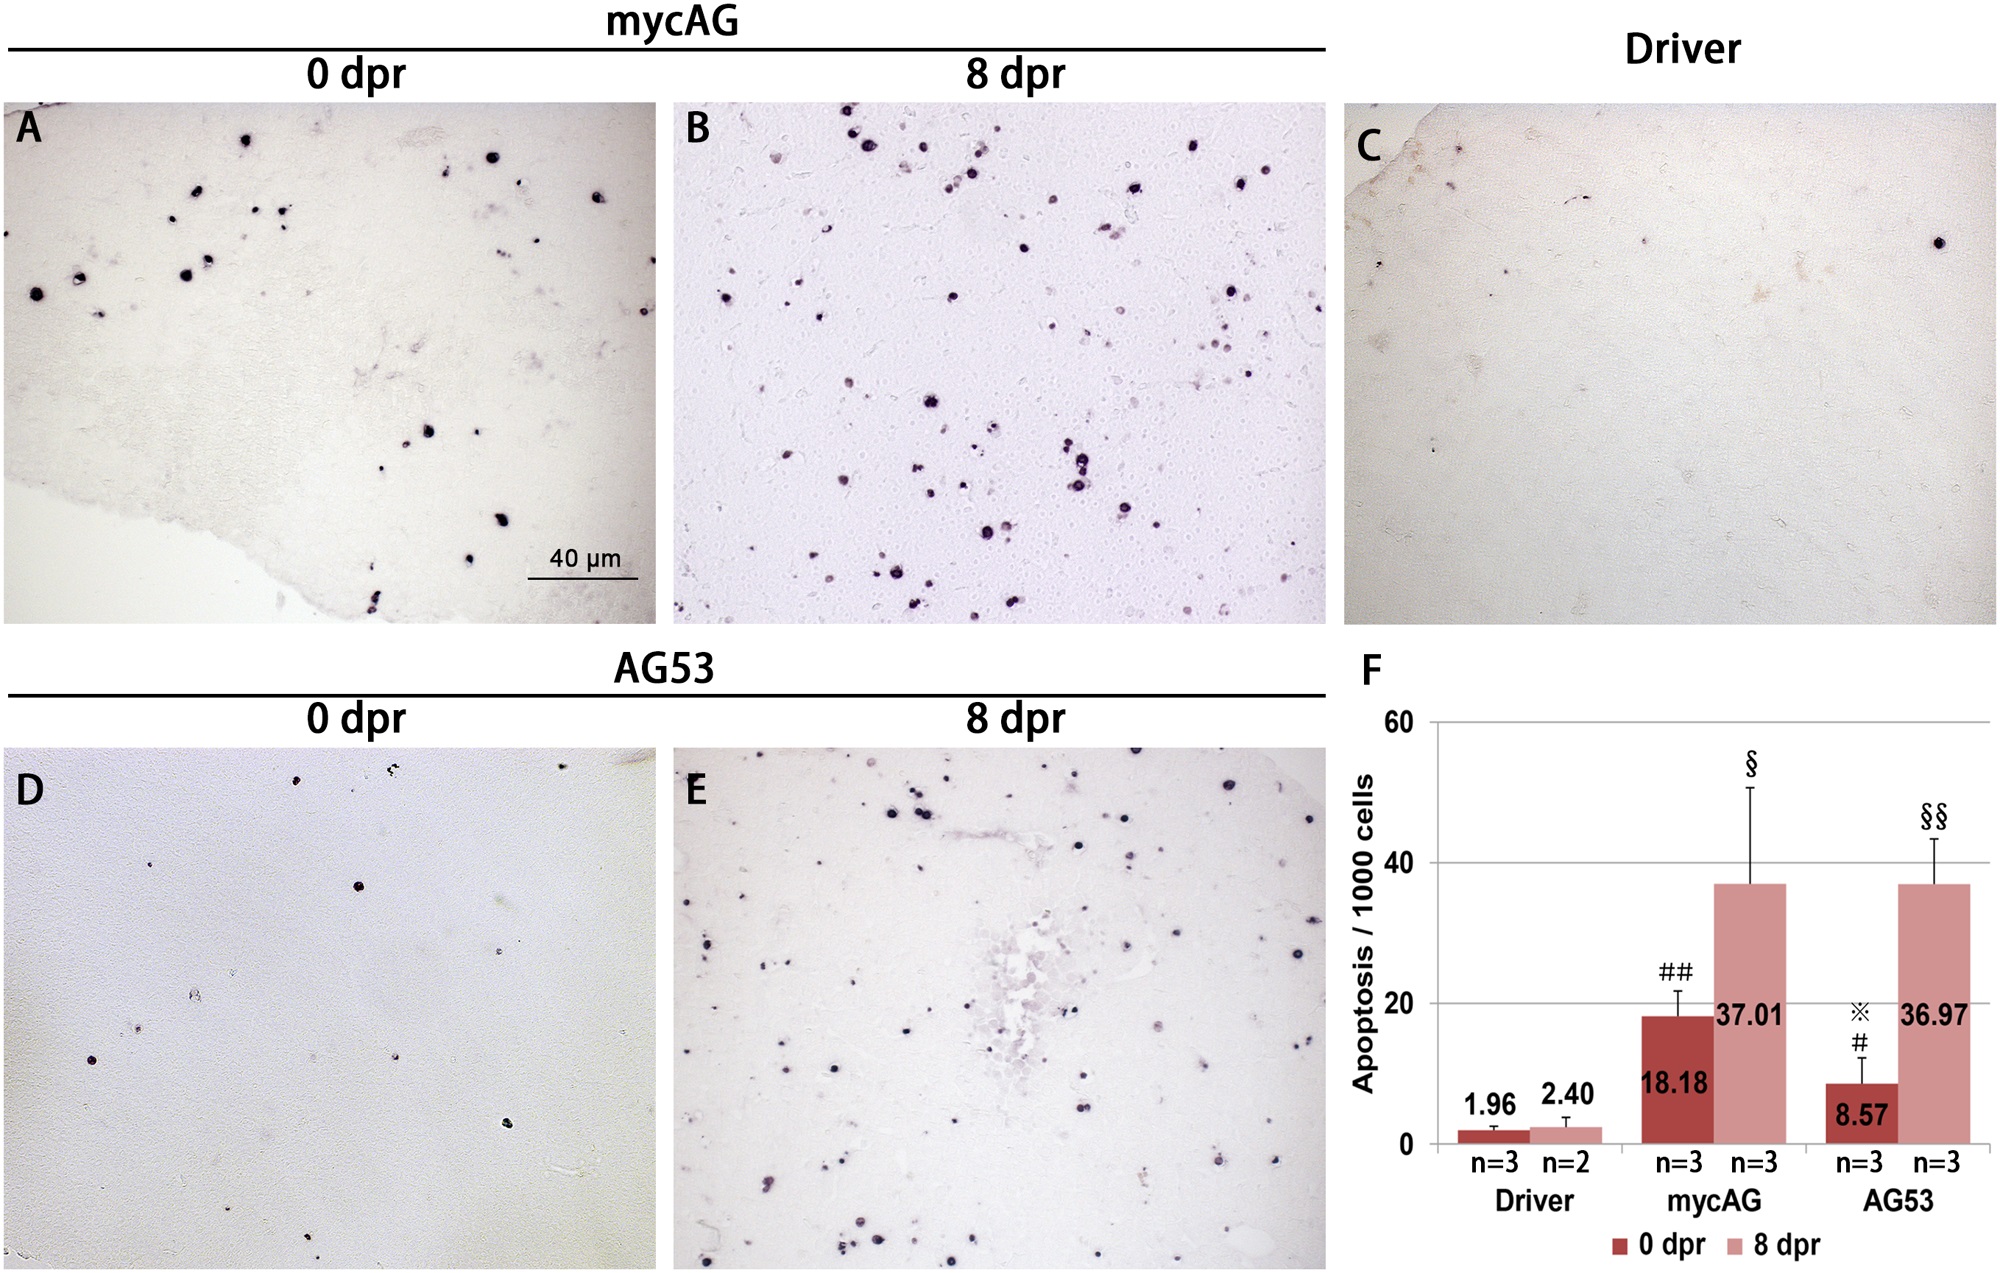
Fig. 7 Increase of apoptosis after mifepristone withdrawal.
MycAG line and AG53 fish were induced by 2 µM mifepristone from 1 mpf and mifepristone was removed after 6 month induction for tumor regression. These fish were then collected for TUNEL assay. (A–E) TUNEL assay for apoptosis on liver sections from different types of fish at different time points as indicated. dpr, day post regression. (F) Quantification of apoptotic cells in liver sectons. and indicate significant difference with p-values of 0.05 and 0.01 respectively when compared to Driver at 0 dpr. § and §§ indicate significant difference with p-values of 0.05 and 0.01 respectively when compared to Driver at 8 dpr. * indicates significant difference (P<0.05) when compared with AG at 0 dpr.