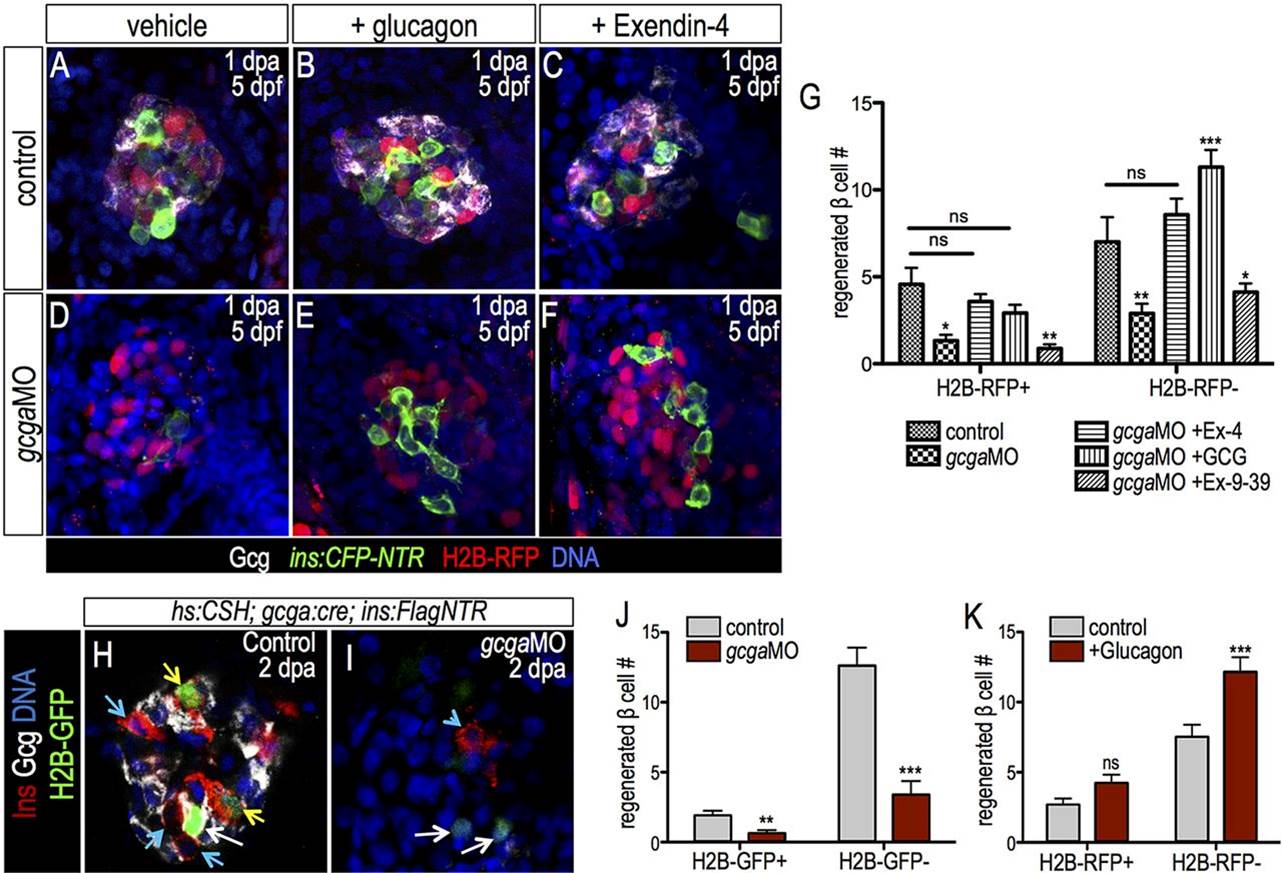
Fig. 5
Differential regulation of β cell progenitor pools by glucagon gene products. (A-F) Confocal projections of 1-dpa H2B-RFP-labeled Tg(ins:CFP-NTR) control islets (A-C) and gcgaMO-injected islets (D-F) that were treated with vehicle (A,D), recombinant glucagon (B,E) or Ex-4 (C,F). Islets were immunostained for CFP (insulin, green) and glucagon (white). β cell regeneration was restored with glucagon or Ex-4 injection, but not with Ex-9-39 injection. (G) Quantification of H2B-RFP+ and H2B-RFP β cell number in control regenerating (n=7) and gcgaMO-injected regenerating islets treated with vehicle (n=9), glucagon (n=13), Ex-4 (n=12) or Ex-9-39 (n=17). (H,I) Confocal planes of 1-dpa Tg(gcga:Cre); Tg(hs:CSH); Tg(ins:Flag-NTR) control and gcgaMO-injected regenerating islets stained for glucagon (white) and insulin (red). α cells were labeled (white arrows) at 3dpf by H2B-GFP before MTZ treatment. Yellow arrows indicate H2B-GFP+ β cells and blue arrows/arrowhead indicate H2B-GFP β cells. (J) Quantification of H2B-GFP+ and H2B-GFP β cells in regenerating control (n=10) and gcgaMO-injected (n=13) islets. (K) Quantification of H2B-RFP+ and H2B-RFP β cells in regenerating islets treated with vehicle or glucagon (n=14). *P≤0.05, **P≤0.01, ***P≤0.001; ns, not significant (two-way ANOVA followed by Bonferroni post-test in G; Student′s t-test in J,K).

