
|
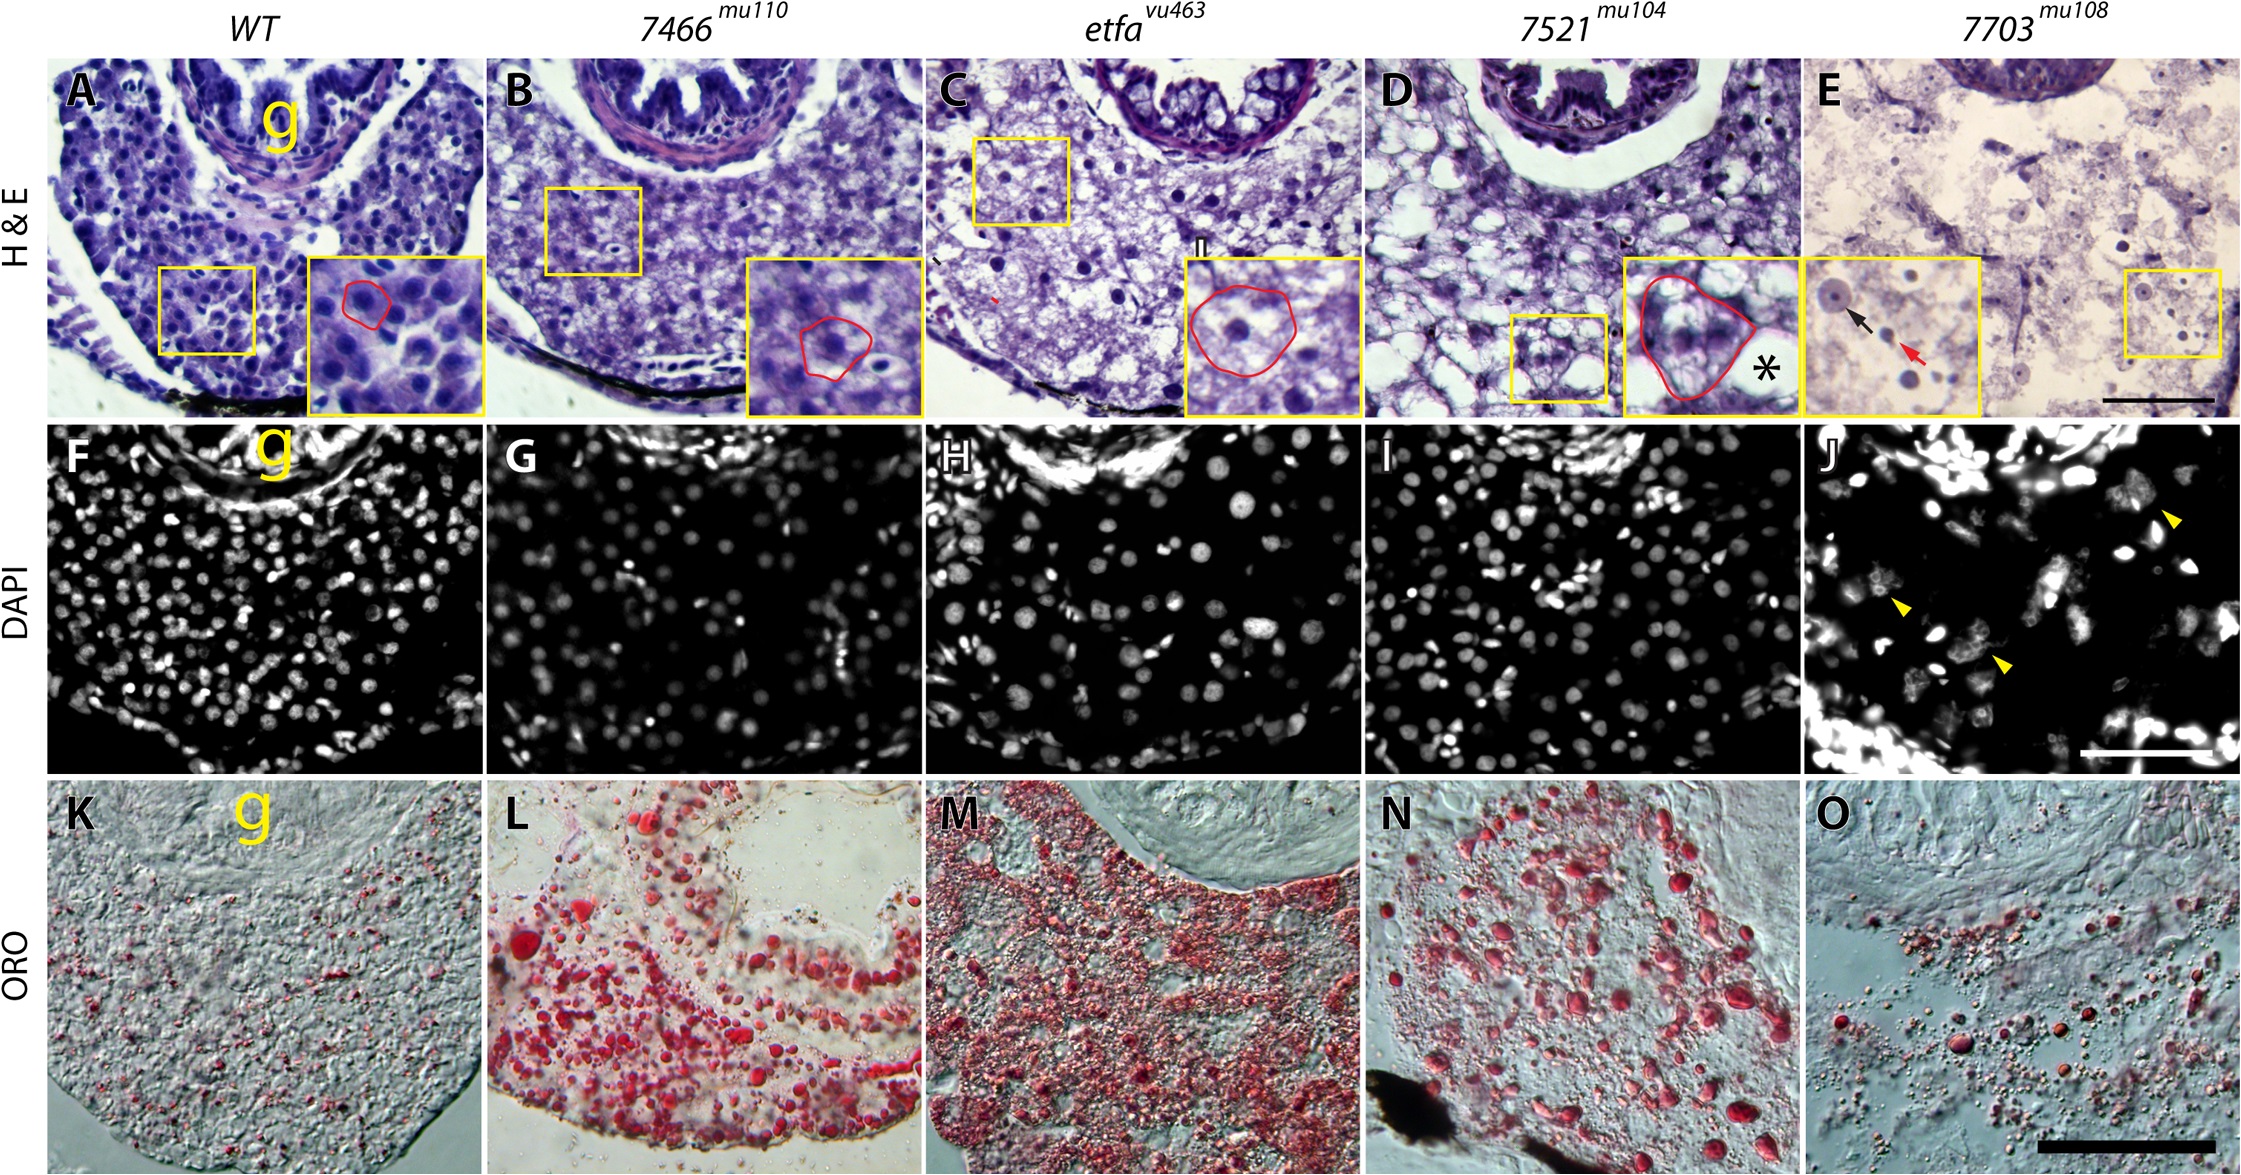
Fig. 5
Histological phenotypes.
On the left panel, H & E (top), DAPI (middle) and oil red oil (ORO, bottom) stained zebrafish livers at 8 dpf are shown. Wild-type control (A,F,K), and mutants (B-E, G-J, L-O) are shown. (B) shows and example of microvesicles in hepatocytes, (C) depicts a liver with swollen hepatocytes, (D) shows a liver with accumulation of large vesicles, and prenecrotic hepatocytes (asterisk), while (E) shows hepatic lysis. The black arrow in (E) points to a nucleus with nuclear membrane and the red arrow points to a condensed nucleus without nuclear membrane. The yellow arrowheads in (J) indicate granulated nuclei. g = gut. Scale bar = 100 �m (A-E) and 50 �m (F-O). n = 9/9 per control and each mutant.