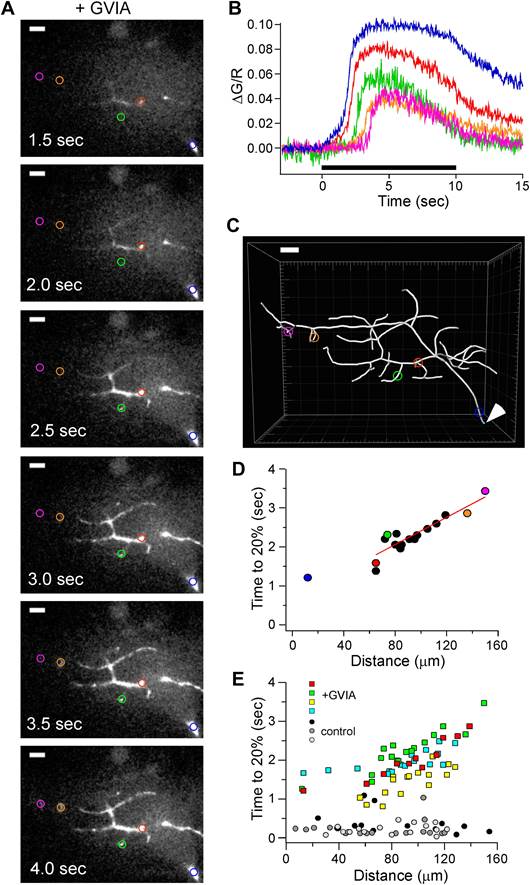
Fig. 7
Distance-dependent delay in Ca2+ rise in ω-conotoxin GVIA-treated CaP boutons.
(A) Sample images of Fluo-5F fluorescence taken at 0.5 s intervals during 100 Hz stimulation. 5 ROIs are shown at different distances from the reference point at the ventral edge of the notochord. (B) The time course of fluorescence change, expressed as ΔG/R, for each of the ROIs shown in A. The black bar indicates the duration of stimulation. (C) Imaris Filament Tracer 3D reconstruction of the same motor neuron based on z-stacks of the Alexa Fluor 647 fill, with the ROIs in A and B overlaid. An arrowhead indicates the reference point for distance measurements. Scale bars in A and C correspond to 10 µm. (D) The time required for each ROI to reach 20% of peak as a function of the distance from the reference point. The distance measurements for each ROI were determined on the basis of Imaris 3D reconstruction. Colored symbols correspond to the individually colored ROIs shown in the A–C. The data points from the boutons, excluding the first distance measurement, were fit by a line with a slope corresponding to 57 µm/s. (E) Scatter plot of distance-dependent Ca2+ rise for 61 ROIs in ω-conotoxin GVIA-treated neurons (n = 4 fish, colored markers) and 47 ROIs in control (n = 3 fish, gray markers). Each neuron was reconstructed using Imaris filament software to obtain the physical distances. Example cell in A–D is shown with green markers. Measurement was obtained with Fluo-5F and 0.5 mM EGTA in the intracellular solution.

