
|
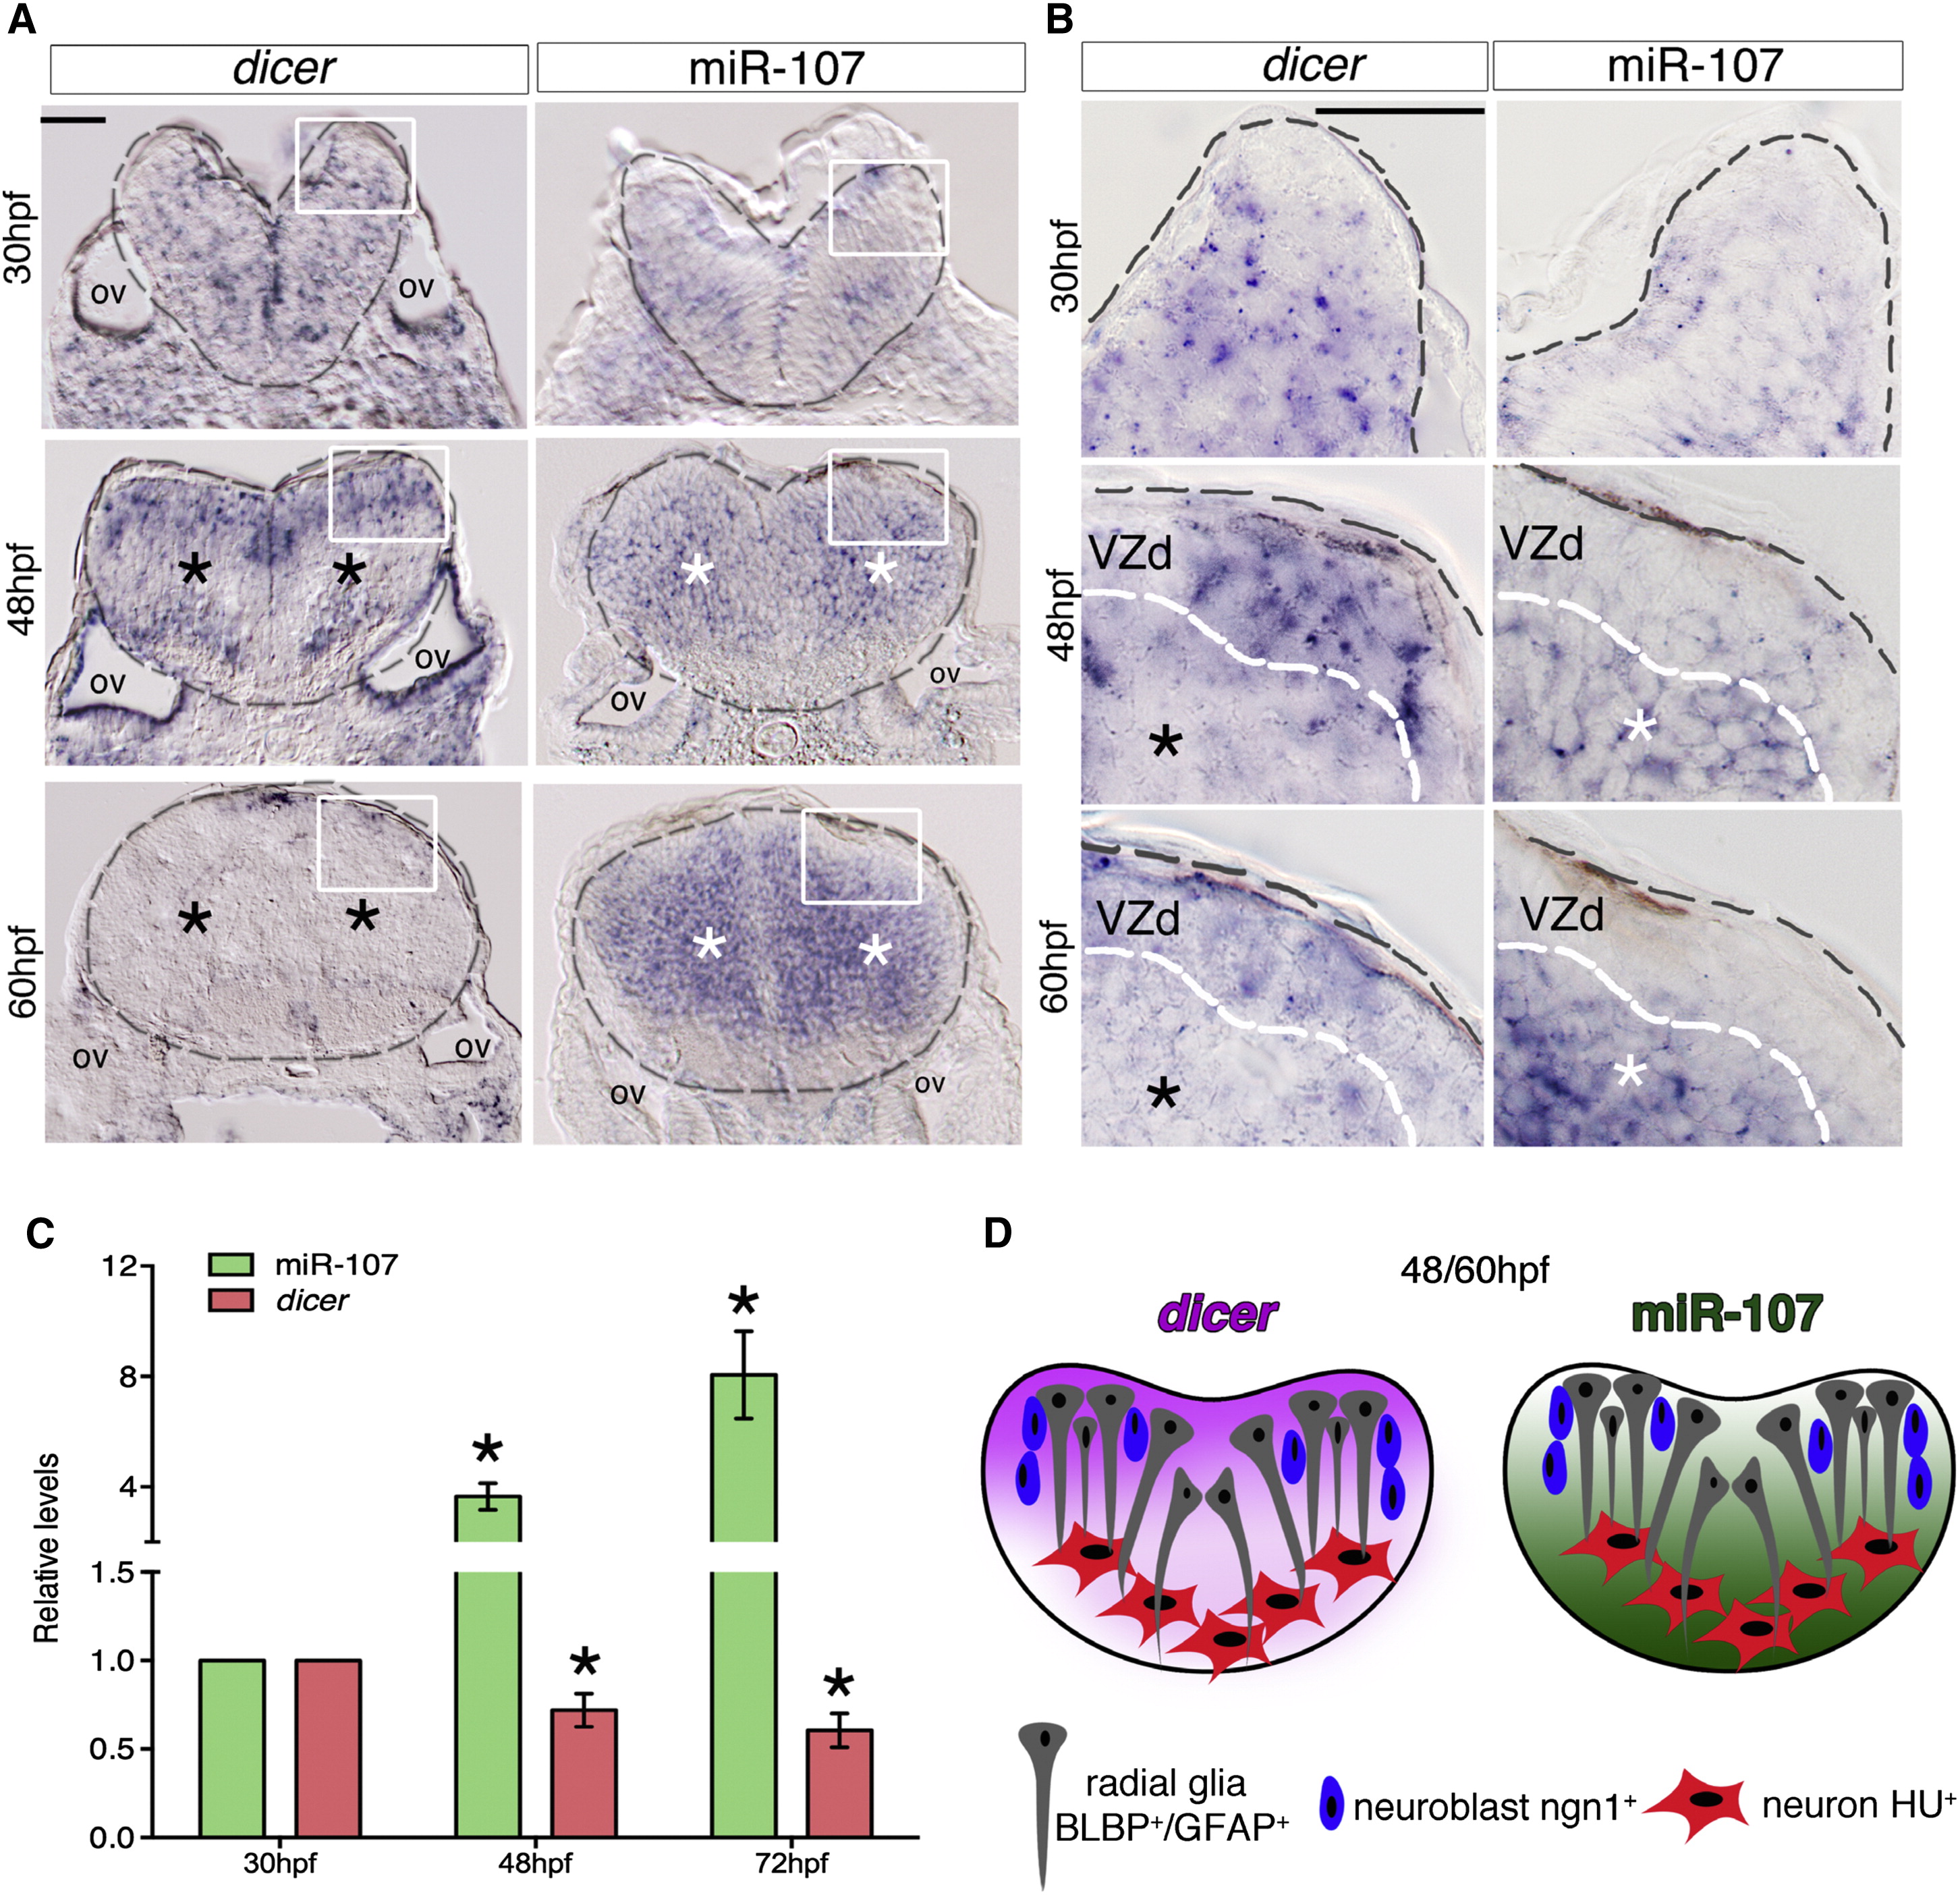
Fig. 3
miR-107 and Dicer Show an Opposite Expression Pattern along the Hindbrain Ventricular Zone
(A and B) Expression of dicer and miR-107 in 15 �m hindbrain cross-sections at 30, 48, and 60 hpf. Gray dashed line indicates the hindbrain area; black stars indicate the area with low dicer expression, while white stars show the region of high miR-107 expression.
(B) High-magnification pictures (60�) of the region boxed in (A).
(C) qRT-PCR of dicer and miR-107 levels at 30, 48, and 72 hpf and relative to the expression levels at 30 hpf. Data are presented as mean � SEM of three independent experiments (n <20 embryos each). p < 0.05.
(D) Graphic representation of the opposite spatial expression of dicer (purple) and miR-107 (green) in the hindbrain from 48 to 60 hpf. Scale bars represent 50 �m.
Reprinted from Developmental Cell, 32(5), Ristori, E., Lopez-Ramirez, M.A., Narayanan, A., Hill-Teran, G., Moro, A., Calvo, C.F., Thomas, J.L., Nicoli, S., A Dicer-miR-107 Interaction Regulates Biogenesis of Specific miRNAs Crucial for Neurogenesis, 546-60, Copyright (2015) with permission from Elsevier. Full text @ Dev. Cell