
Image
|
Figure Caption
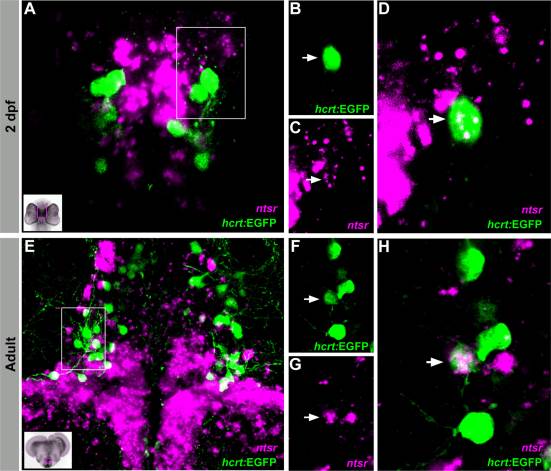
Fig. 6
A subpopulation of ntsr-expressing HCRT cells in the hypothalamus. A–D: Z-stack (A) and single plane (B–D) images of coexpressed ntsr (magenta) and HCRT (green) cells in 2 dpf larvae. E–H: Z-stack (E) and single plane (F–H) images of transversal adult brain sections showing colocalization of ntsr- (magenta) and HCRT- (green) expressing cell bodies. Arrows indicate representative coexpressing cells (white).
Figure Data
Acknowledgments
This image is the copyrighted work of the attributed author or publisher, and
ZFIN has permission only to display this image to its users.
Additional permissions should be obtained from the applicable author or publisher of the image.
Full text @ J. Comp. Neurol.