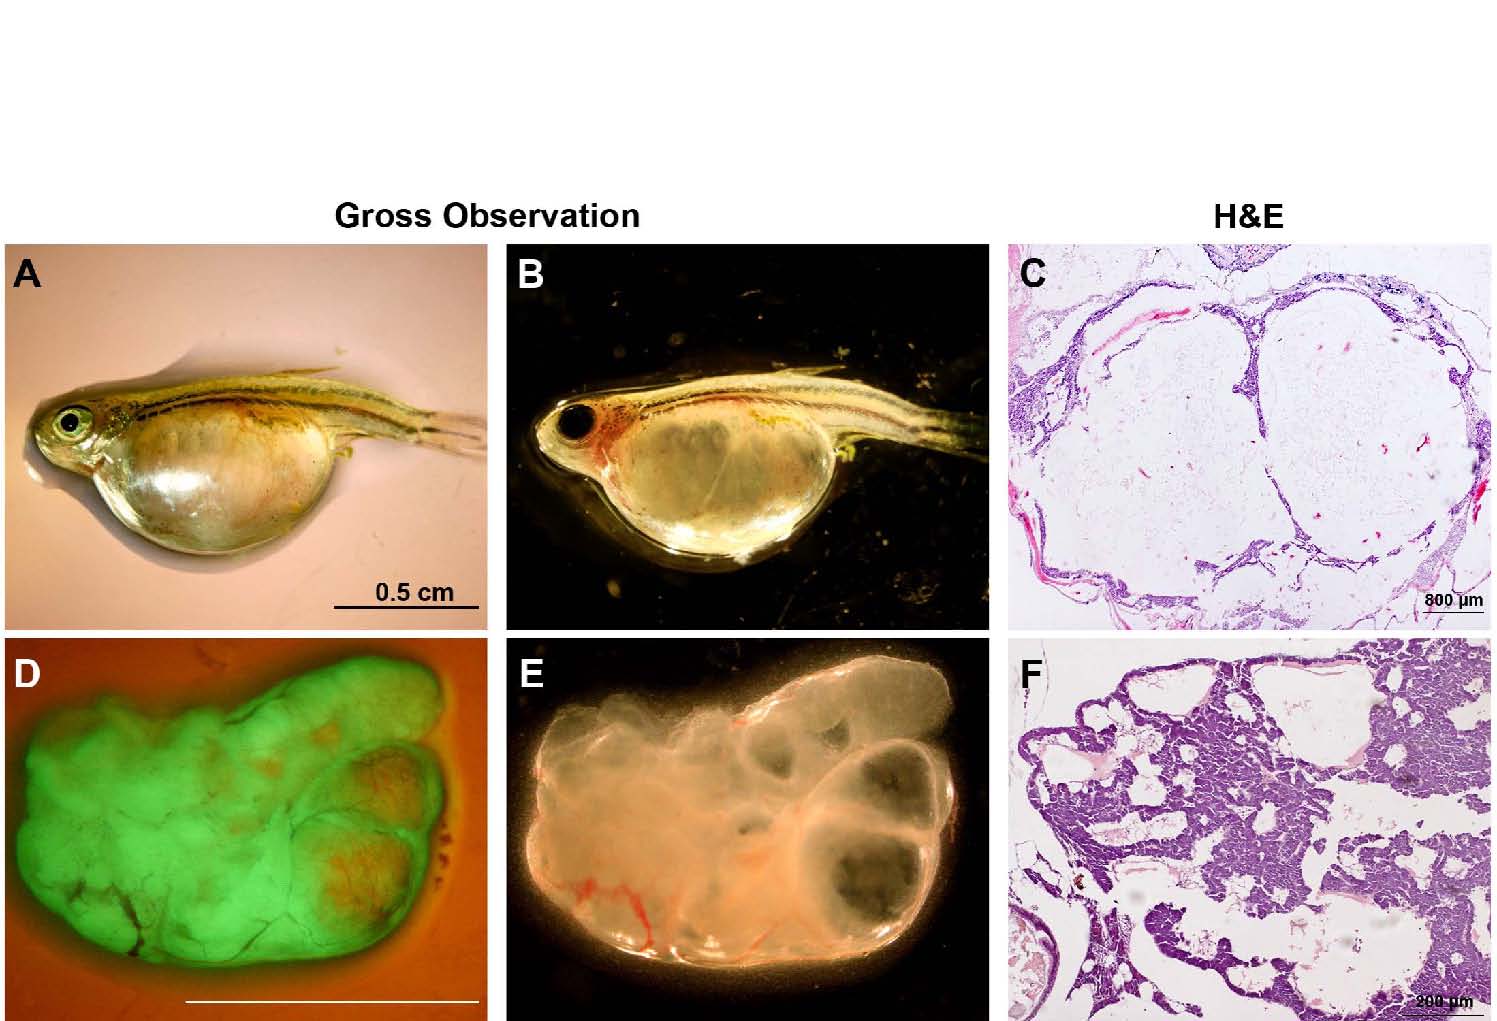
Fig. S3 Ascites in mycAG zebrafish.
MycAG fish were induced by 2 ÁM mifepristone from 1 mpf and sampled at 7 mpf (6 mpi) for gross observation and histological examination. (A) Gross observation of the mycAG fish with ascites phenotype in monotone background. (B) Gross observation of the same fish in (A) under a dark background to show transparent belly. (C) H&E staining of the fish presented in (A,B). (D, E) Isolated liver tumor from another mycAG fish with ascites for GFP view (D) and for view in a dark background to show transparent, foam-like structure (E). Liquid was observed in cysts in the liver. (F) H&E staining of the liver tumor presented in (C,D).

