Fig. S7
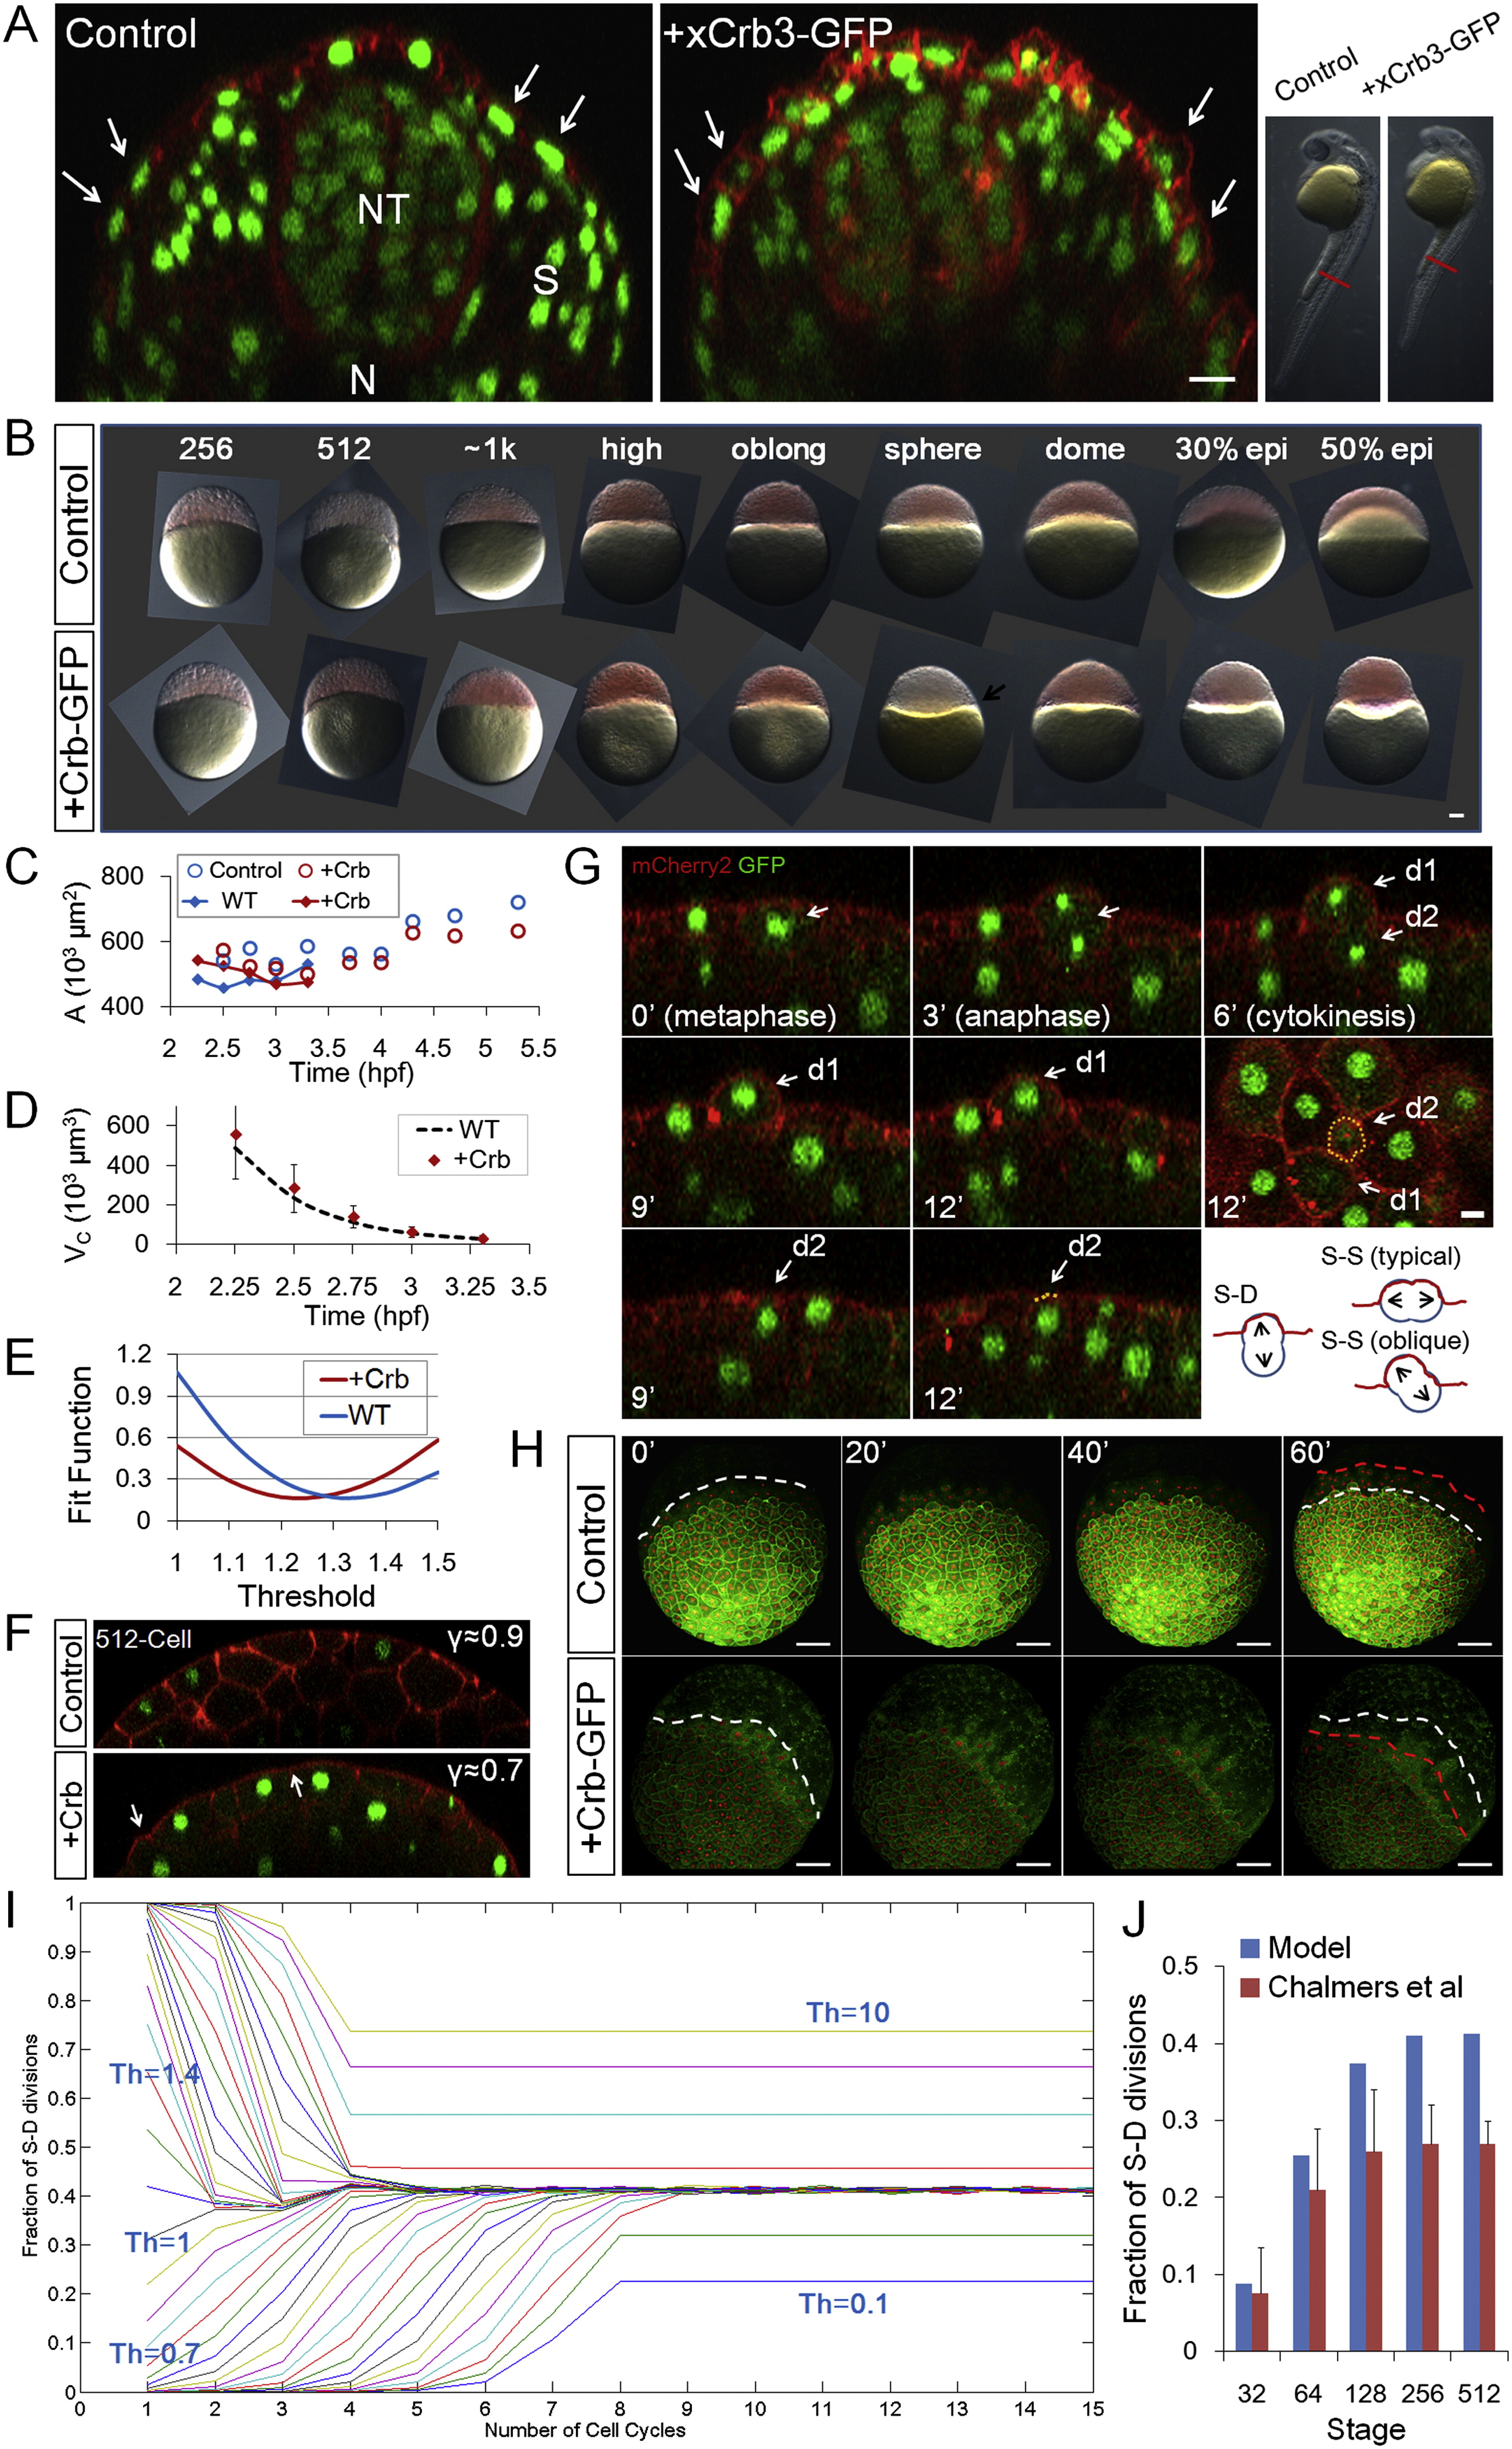
Effects of Parameter Changes on Morphogenesis and Steady States and the Effects of Crumbs Injection on Different Parameters, Related to Figure 7
(A) 30hpf EVL phenotypes of Crb3-GFP injected embryos. Images are cross-section confocal slices capturing the EVL/periderm (arrows), the neural tube (NT), the somites/muscles (S) and the notochord (N) at the indicated anterior-posterior level of the shown embryos (red bars in the bright field images on the right). The Crb3-GFP injected embryos have denser EVL cells that are more columnar shaped compared to controls (arrows) while other tissues appear normal. ~20% (18/94, 5 different experiments) of injected of embryos showing clear Crb phenotype at early stages (as seen in (B)) develop over 24hpf and appear shorter and delayed. Scale bar: 20Ám.
(B) Time sequence of bright field lateral view images of Crb injected embryos. The embryos are not distinguishable in appearance compared to control (mem-mCherry injected) embryos in the pre-EVL stages. The difference arises at sphere stage where unlike controls that start to dome and spread, the Crb+ cells pull back (?reverse doming,? arrow). The phenotype becomes more apparent later (?reverse epiboly,? see also (H)) although 20% of these embryos do complete epiboly. Scale bar: 100 Ám.
(C) Measurement of surface area of control and Crb injected embryos. Circles are global estimations, lines are NS multiplying < AC > as in Figure 2A. The change of shape of cells results in surface area changes that are more apparent in later stages.
(D) Cell volume measurement using < L2R >. The WT curve is from Figure 2B. No discernible difference of volume change rate is found in Crb+ embryos. Error bars are SD.
(E) Crb injected surface cells have a lower Th. Fit function is calculated by summing up the squares of differences between expected fraction of S-D division (predicted by Equation 17) and cell tracking data points. The smaller the fit function, the better the fit. For WT, data in Figure 3G is used; for +Crb, data in Figure 7H is used. For both Sh is set at 10.
(F) ? parameter is reduced in Crb injected cells. Arrows indicate less smooth surface at cell-cell contacts indicating an increased contact angle ? and smaller ?.
(G) Example instance of ?oblique? divisions in Crb injected embryos. In oblique divisions (Chalmers et al., 2003), the division orientation is close to perfect S-D (perpendicular to surface), however, the presumptive deep daughter retains a small apical surface (d2 in the images) and remains a surface cell. This is a possible cellular mechanism of the observed effective Th change and the role of Crb in promoting apical membrane might explain the increase of oblique divisions. 16/122 of divisions tracked in Crb+ embryos were oblique, while rare occurrences were found in WT. Scale bar: 10Ám.
(H) Retreat of epiboly frontier in Crb injected embryos. Images are 3D volume rendering of confocal stacks. The embryos are oriented sideways so the border between the cells and the yolk (the YSLs) can be followed. White lines mark the progress line (frontier) of epiboly using the edge of YSL nuclei. Red lines mark the frontier one hour later and progress of epiboly can be seen with the initial white lines. All of the Crb injected embryos exhibit ?reverse epiboly.? Surprisingly, a fraction of these embryos (<20%) eventually return to progressive epiboly and develop into embryos as seen in (A). Scale bar: 100 Ám. See also Movie S1.
(I) Convergence to steady states with similar S-D division ratios for most Th values between 0 and 1. See also Data S1, Text 16.
(J) Model prediction of S-D division ratio in frog and comparison with measurements by Chalmers et al. (2003) (data approximated from Figure 5B of this reference).
Reprinted from Cell, 159, Xiong, F., Ma, W., Hiscock, T.W., Mosaliganti, K.R., Tentner, A.R., Brakke, K.A., Rannou, N., Gelas, A., Souhait, L., Swinburne, I.A., Obholzer, N.D., Megason, S.G., Interplay of Cell Shape and Division Orientation Promotes Robust Morphogenesis of Developing Epithelia, 415-427, Copyright (2014) with permission from Elsevier. Full text @ Cell

