Fig. S6
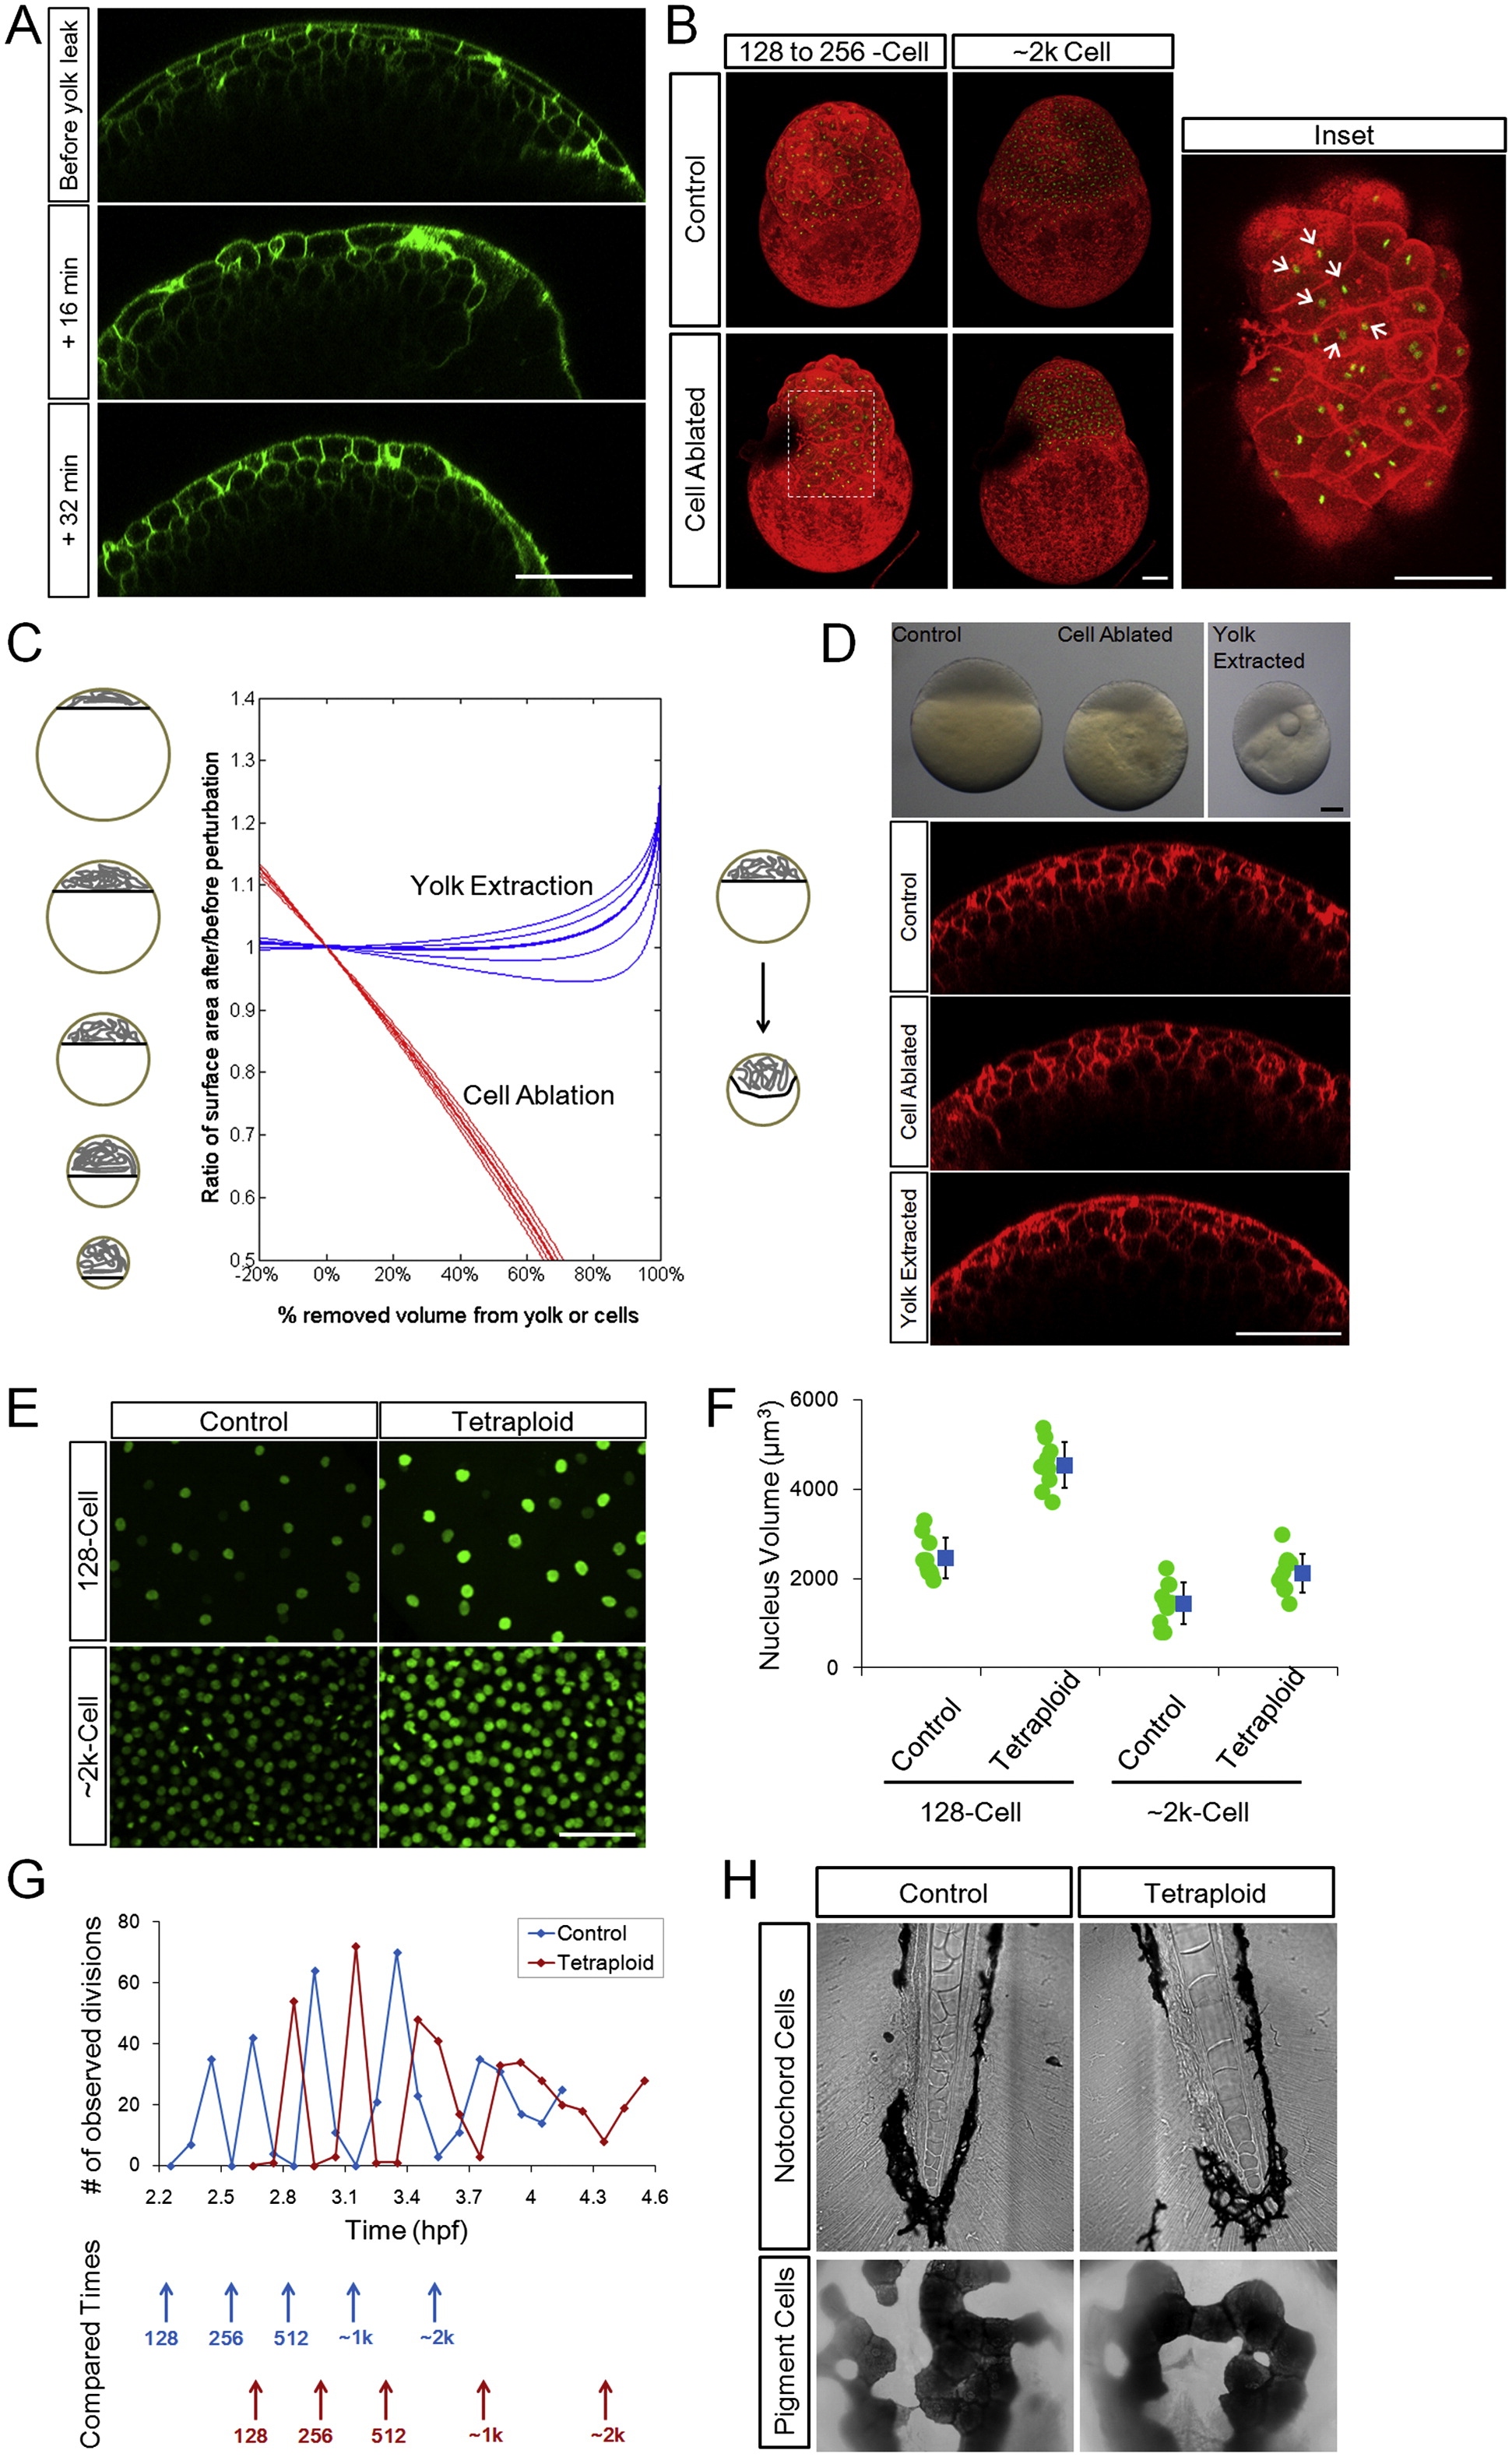
Phenotypes of Yolk Extraction, Cell Ablation, and Tetraploidy, Related to Figure 6
(A) Surface morphological changes following yolk loss. Embryos are fragile after yolk extraction procedure and are not suitable for immediate imaging mounting procedures. Here we found an embryo that had a yolk leak during live imaging. Green fluorescence marks cell membranes. All scale bars: 100Ám.
(B) Local stretching and S-S divisions at the cell ablation site. Images are 3D maximum projections of H2B-EGFP, mem-mCherry labeled embryos. The dark region in the perturbed embryo shows the ablation site. Note that by 2k-cell stage the site has completely healed, however due to remaining debris at the ablation site its imaging signal is weak. Arrows: daughter nuclei of S-S divisions of surface cells that stretched toward the ablation site.
(C) Schematic (left) and theoretical (middle) effect of yolk extraction and cell ablation on total surface area of the surface cells. In reality, yolk extraction causes cells to bulge inward into the yolk (right) resulting further reduction of surface area. See also Data S1, Text 12.
(D) Phenotypes of yolk extraction and cell ablation. Embryos in upper bright field images correspond to confocal images below, showing similarly flattened surface cells. Red fluorescence indicates mem-mCherry.
(E) Nuclear sizes of control and tetraploid cells. Green fluorescence indicates H2B-EGFP.
(F) Quantification of nuclear sizes as in (D). Blue markers indicate average ▒ SD.
(G) Changed division time and cell cycle duration in tetraploid embryos. Division events are counted by the number of anaphase cells at each time point. The time points between divisions (marked by arrows) were chosen for VC, NS and < L/R > comparison in Figures 6H?6L.
(H) Verification of tetraploidy at later stage by sizes of differentiated cells in different tissues. Upper: notochord cells are larger and packed differently in tetraploids and blood cells are bigger. Lower: the skin pigment cells have larger surface area and visibly larger nuclei in tetraploids and are more clustered.
Reprinted from Cell, 159, Xiong, F., Ma, W., Hiscock, T.W., Mosaliganti, K.R., Tentner, A.R., Brakke, K.A., Rannou, N., Gelas, A., Souhait, L., Swinburne, I.A., Obholzer, N.D., Megason, S.G., Interplay of Cell Shape and Division Orientation Promotes Robust Morphogenesis of Developing Epithelia, 415-427, Copyright (2014) with permission from Elsevier. Full text @ Cell

