Fig. 1
Quantitative Description of Surface Cell Shape Change of Zebrafish Embryos
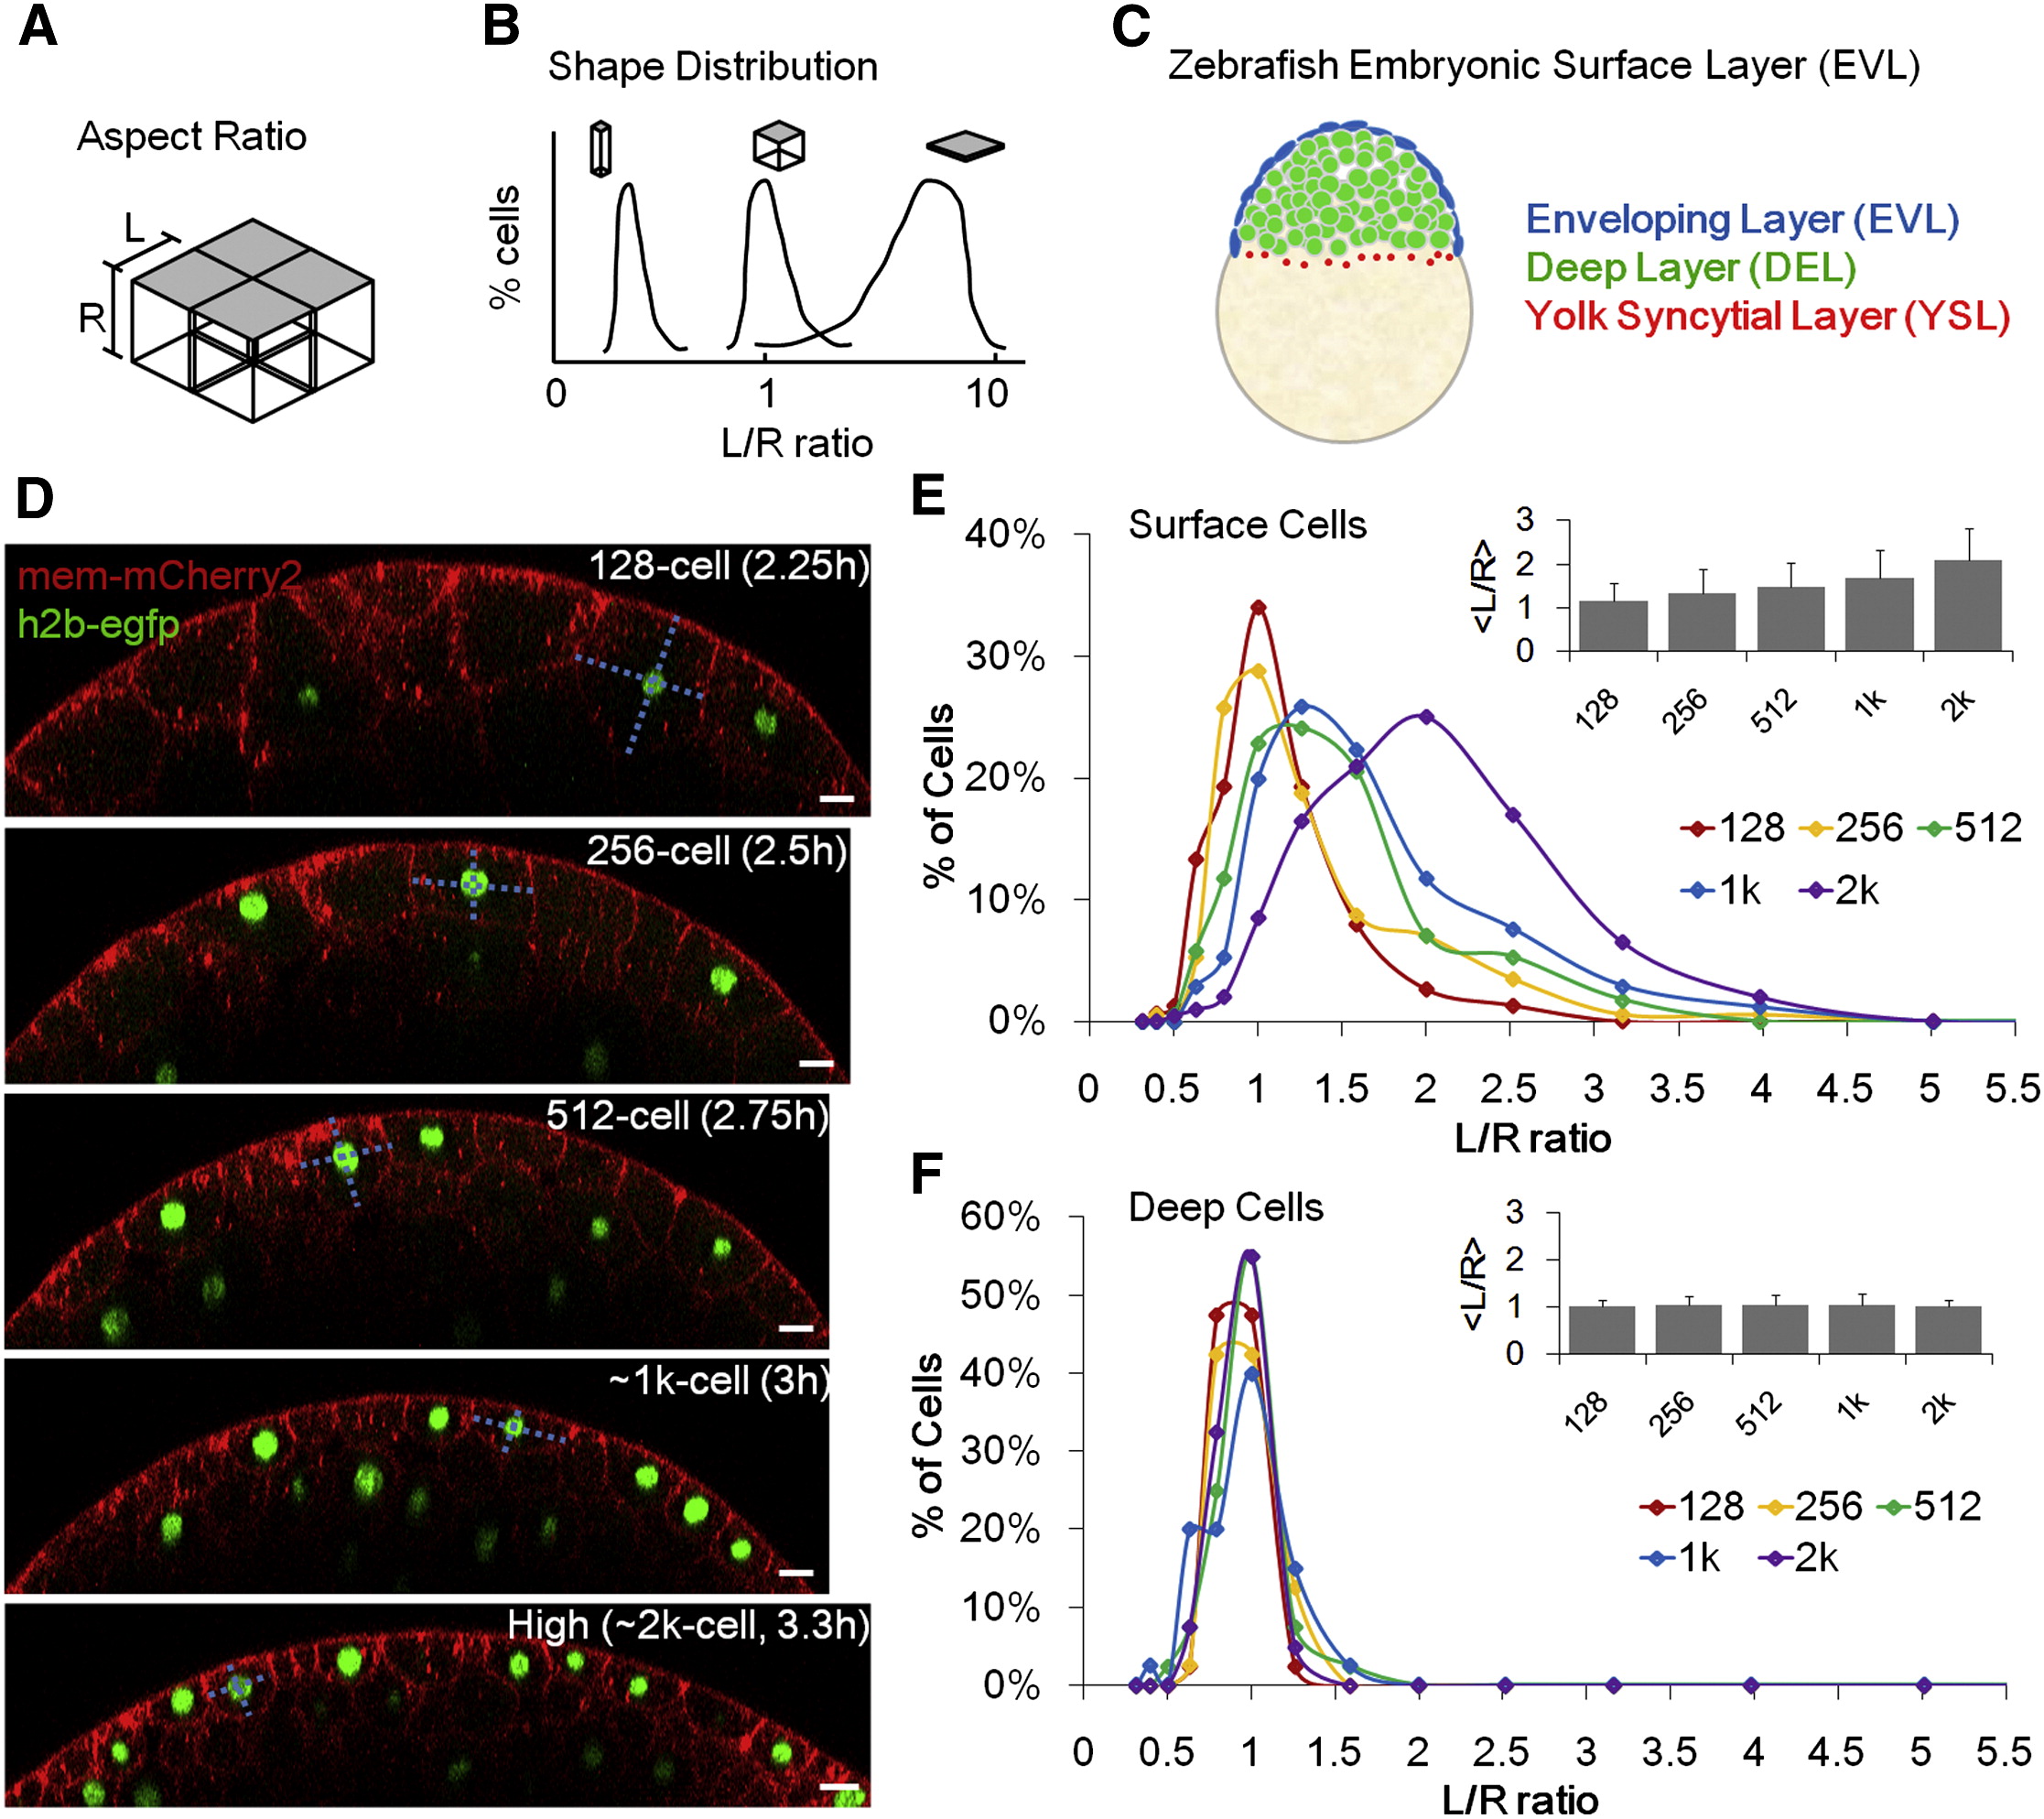
(A) Schematic illustration of simplified epithelial monolayer, gray indicates the free surface, cell shape is represented by aspect ratio L/R.
(B) The morphology of an epithelial layer is represented as a distribution of L/R ratios.
(C) Zebrafish enveloping layer (EVL, blue) in the context of the whole embryo. Sketch represents a lateral cross-section of an oblong (~4 k cell) stage embryo.
(D) Time-lapse imaging data and measurement of surface cell L/R ratios (dashed cyan lines). Scale bars represent 20 Ám. See also Figures S1D?S1H.
(E) Morphogenesis of surface layer over five cell cycles. n = 860. Inset: average L/R ▒ SD.
(F) Morphogenesis of deep layer over five cell cycles. n = 200. Inset: average L/R ▒ SD. The variance of ln(L/R) of deep cells is smaller than that of surface cells (f tests).
Reprinted from Cell, 159, Xiong, F., Ma, W., Hiscock, T.W., Mosaliganti, K.R., Tentner, A.R., Brakke, K.A., Rannou, N., Gelas, A., Souhait, L., Swinburne, I.A., Obholzer, N.D., Megason, S.G., Interplay of Cell Shape and Division Orientation Promotes Robust Morphogenesis of Developing Epithelia, 415-427, Copyright (2014) with permission from Elsevier. Full text @ Cell

