
|
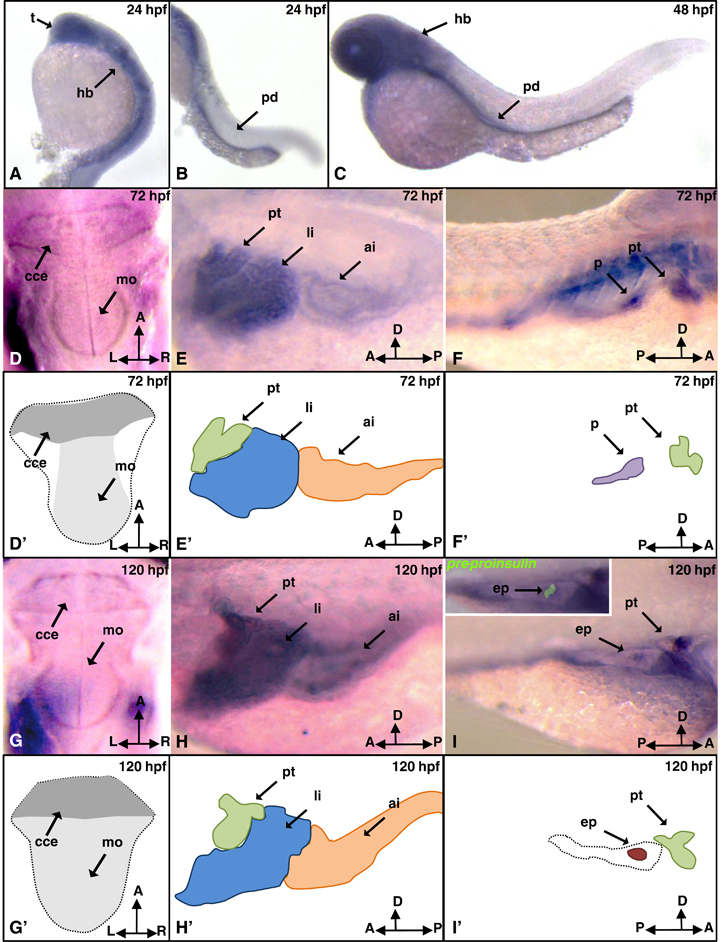
Fig. 1
Localization of the expression of glut2 in zebrafish. Whole-mount in situ hybridization showing expression of zebrafish glut2 mRNA at 24 hours post fertilization (hpf; A and B), 48 hpf (C), 72 hpf (D–F), and 120 hpf (G–I). Left (A–C, E, and H), right lateral views (F and I), and dorsal views of the hindbrain region (D and G) are shown. To confirm glut2 expression in endocrine pancreas, double in situ hybridization showing pre-proinsulin expression was performed (I, inset). (D′–I′) Schematic representations of D–I highlighting with different colors the regions where glut2 is expressed. Black dotted contours outline the hindbrain region (D′ and G′) and the pancreas (I′). Anterior intestine (ai), corpus cerebelli (cce), endocrine pancreas (ep), hindbrain (hb), liver (li), medulla oblongata (mo), pronephric duct (pd), pronephric tubule (pt), telencephalon (t).