
IMAGE
Fig. 5
Image
|
Figure Caption
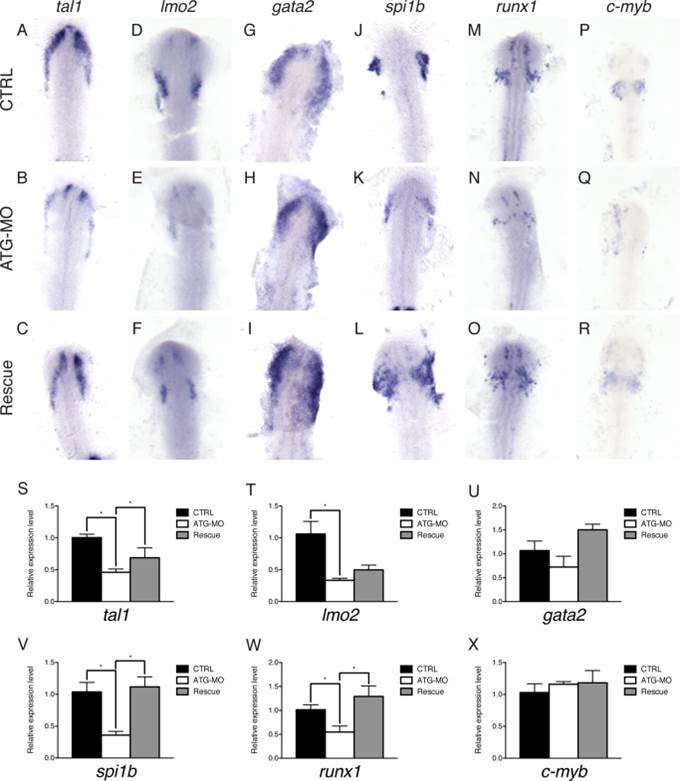
Fig. 5
smoc2 morphants display defects in hematopoiesis at 12 ss. A?R: Dorsal view of anterior lateral plate mesoderm; anterior to the top. WISH analysis for tal1 (A?C), lmo2 (D?F), gata2 (G?I), spi1b (J?L), runx1 (M?O), and c-myb (P?R) of control embryos, ATG morphants and rescue embryos at 12 ss (n e 12). S?X: Quantification of changes in expression levels by qPCR. Values plotted as mean �SEM; n≥4; *P<0.05.
Figure Data
Acknowledgments
This image is the copyrighted work of the attributed author or publisher, and
ZFIN has permission only to display this image to its users.
Additional permissions should be obtained from the applicable author or publisher of the image.
Full text @ Dev. Dyn.