
|
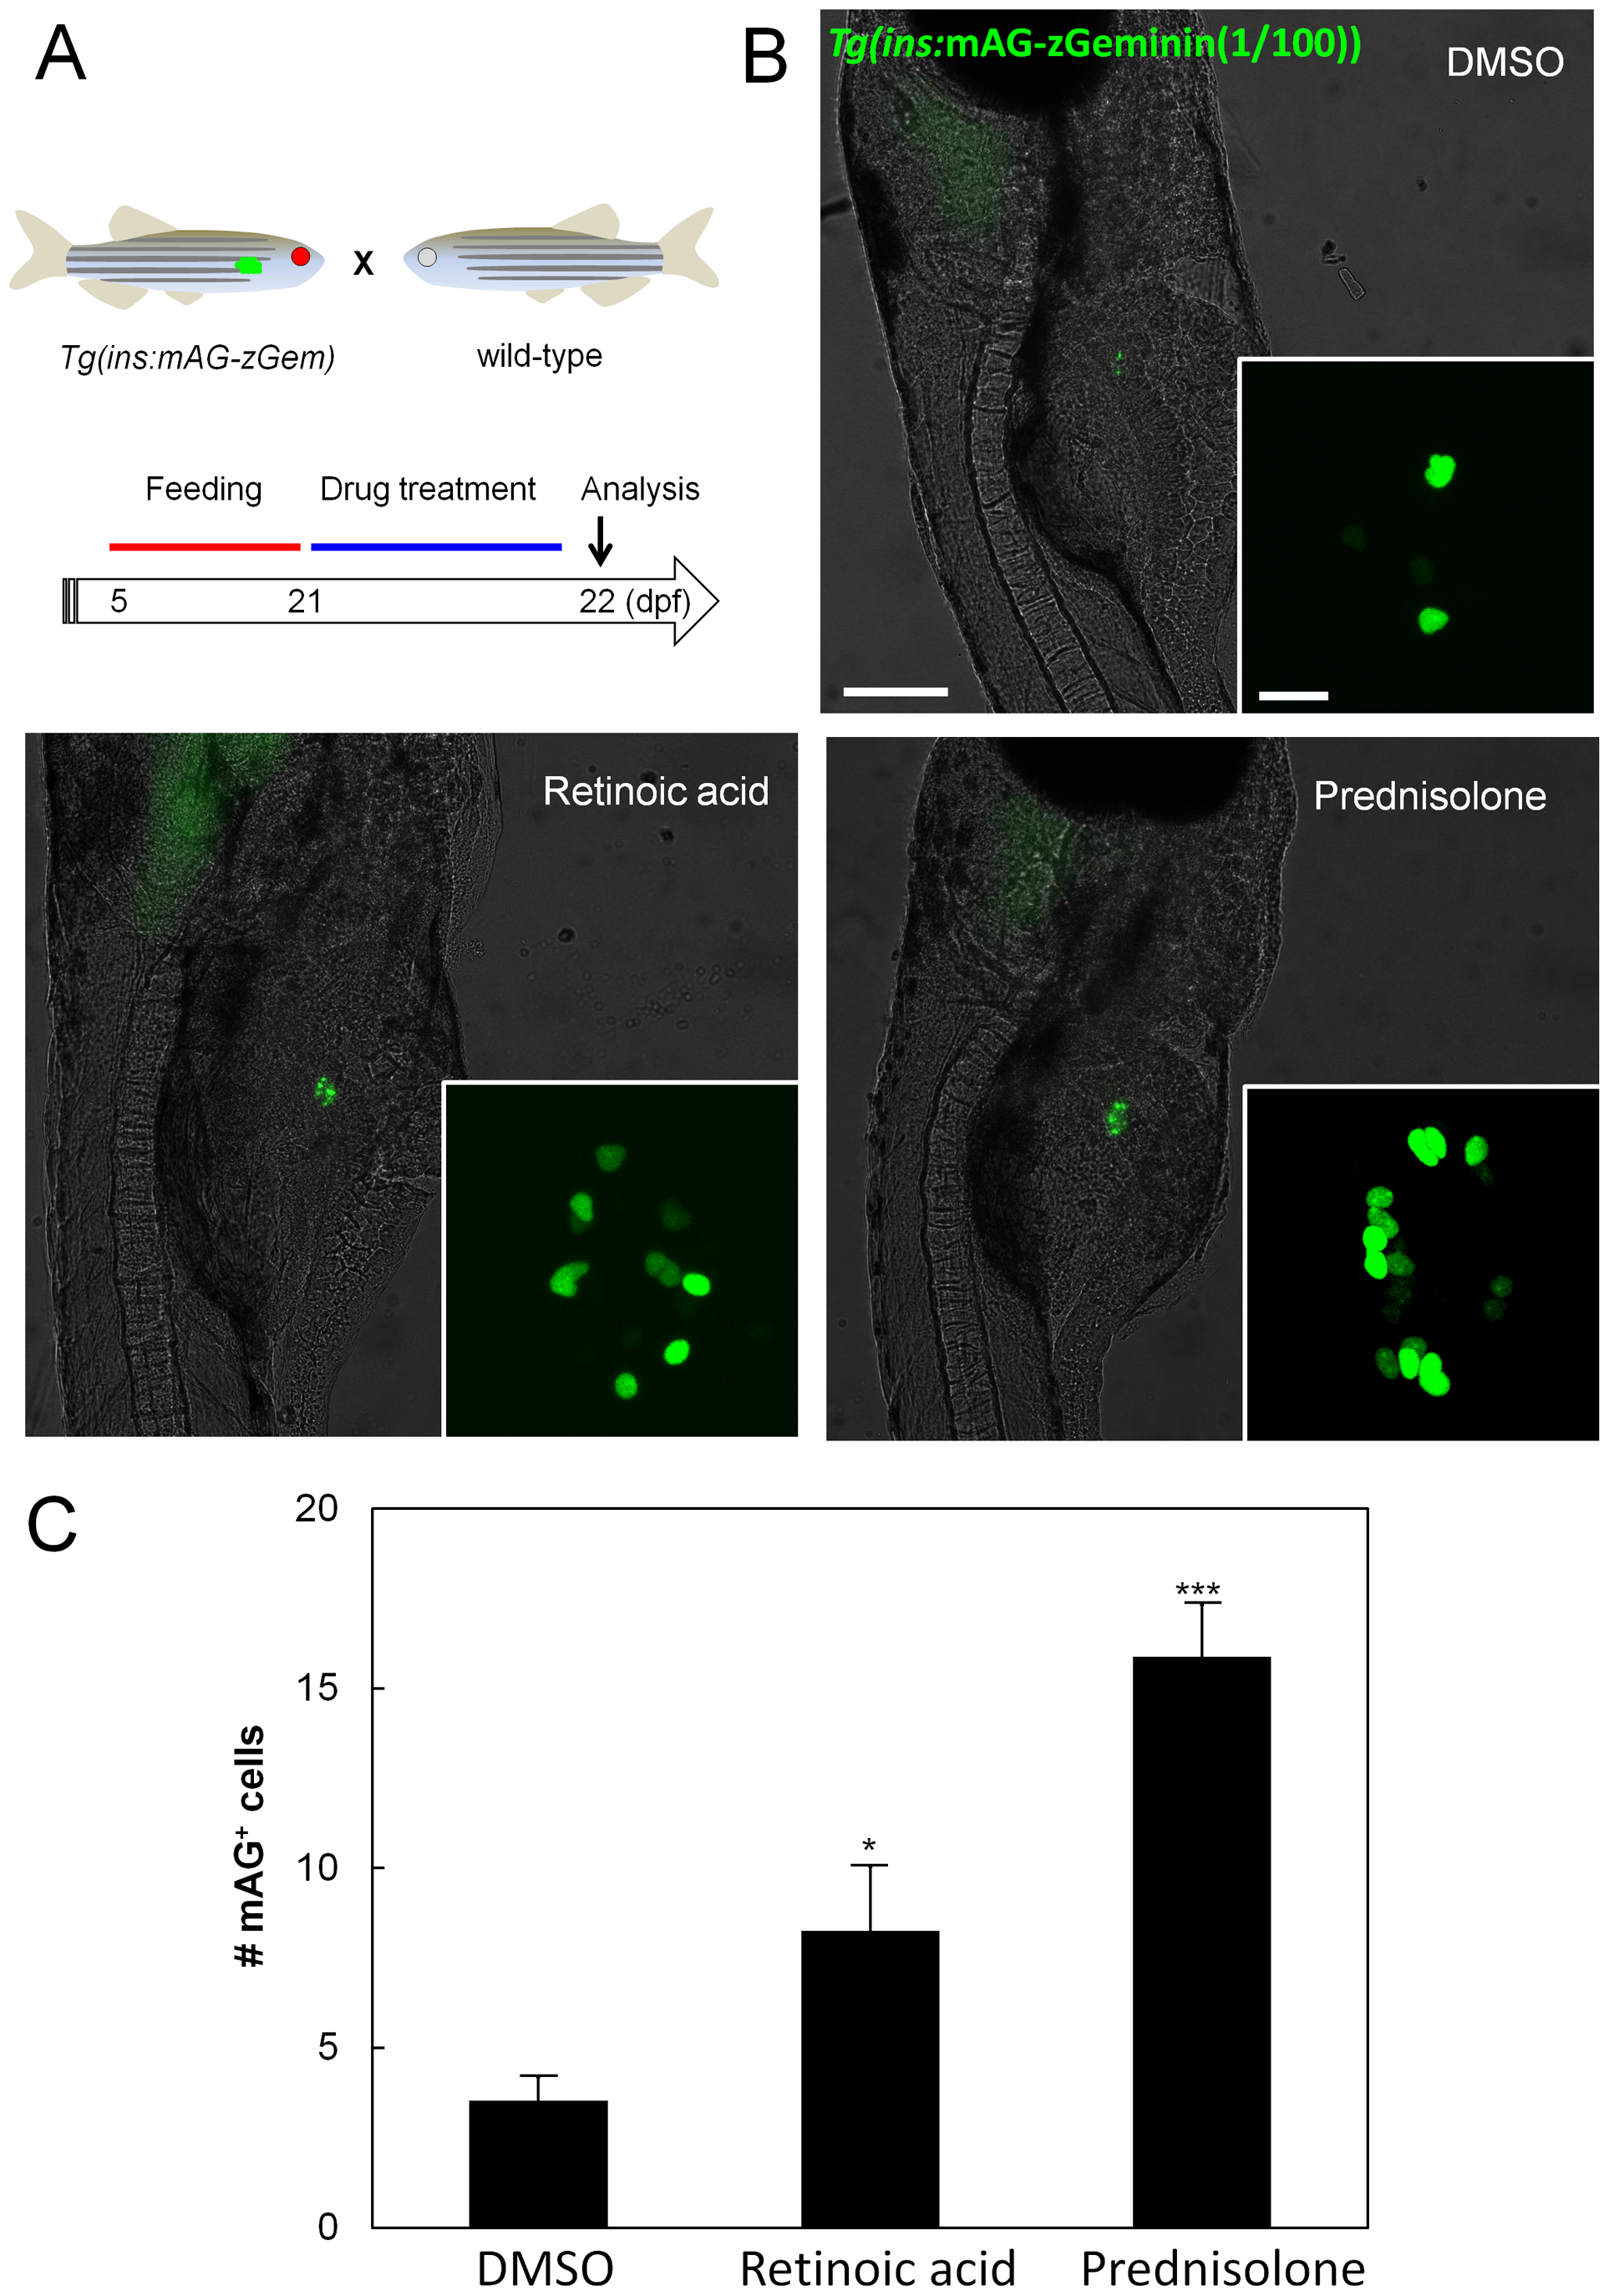
Fig. 3
RA and Prednisolone effectively increase beta-cell proliferation under feeding metabolism.
(A) Schematic diagram for assessment of beta-cell proliferation. At 21 dpf, after feeding from 5?21 dpf with Kyowa N-250 (Kyowa), Tg(ins:mAG-zGeminin(1/100))s947 larvae were treated with 1 μM retinoic acid or 10 �M prednisolone in 1% DMSO. The number of Tg(ins:H2BGFP)+ cells was counted at 22 dpf. (B) Tg(ins:mAG-zGeminin(1/100))s947 + beta-cells were examined at 22 dpf using an epifluorescence microscope. Scale bar = 200 μm. A close up of the islet examined using a confocal microscope is shown in the inset. Scale bar = 10 μm. (C) Quantification of proliferating beta-cells per larva at 22 dpf. Error bars represent SEM. *P<0.05, and ***P<0.005 compared to DMSO-treated controls; n = 13?16 animals for each group.