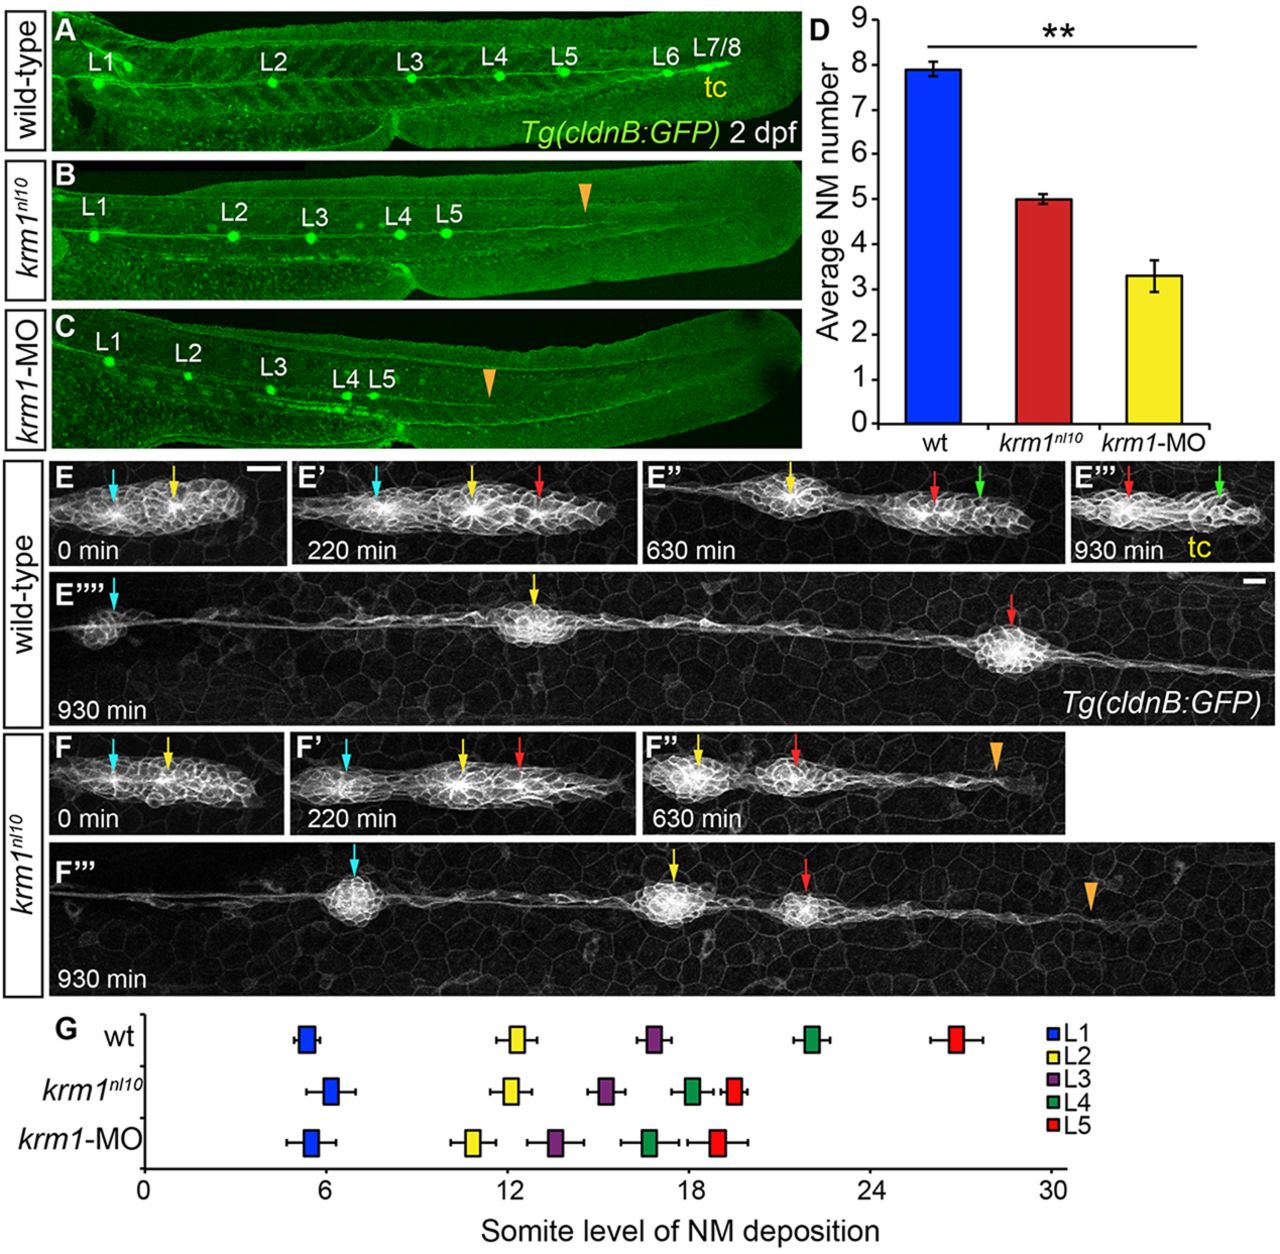
Fig. 1
The pLL is truncated in krm1nl10 mutants. (A-C) Confocal projections of 2dpf larvae expressing Tg(cldnB:GFP), (L1-L8: pLL NMs 1-8). (A) WT embryo showing completed pLLP migration and deposition of all NMs. (B) In a krm1nl10 mutant, there are fewer deposited NMs and the pLLP stalled prematurely (orange arrowhead). (C) kremen1 morphants show a similar reduction of NMs and pLLP stalling (orange arrowhead). (D) Quantification of neuromasts in WT, krm1nl10 mutant and krm1-MO-injected embryos (n=10 embryos per condition; **P<0.001, one-way ANOVA). (E-F4) Still confocal projections from live 930-min time-lapse movies showing pLLP migration in WT and krm1nl10 embryos beginning at 36hpf. At 0min, WT and mutant primordia contain two proto-NMs (E,F, blue and yellow arrows). By 220min, both WT and mutant primordia have added an additional proto-NM (E2,F2, red arrow). (E3) At 630min, the WT pLLP contains the proto-NMs that will form the terminal cluster (green arrow). By contrast, the krm1nl10 pLLP fail to form a new proto-NM and migrate as a thin trail of cells (F3, orange arrowhead). By 930min, WT pLLP has migrated out of frame (EW) and formed the tc (E4). The mutant pLLP has stalled (a thin trail of cells extended from the last deposited NM, marked by orange arrowhead; F4). (G) Quantification of L1-L5 NM location based on somite level (tc is not included). NMs are shifted anteriorly in krm1nl10 mutant and krm1-MOrphants relative to WT embryos (n=6 embryos per condition; P<0.001, two-way ANOVA with replication). Scale bars: 20μm. NM, neuromast; tc, terminal cluster.

