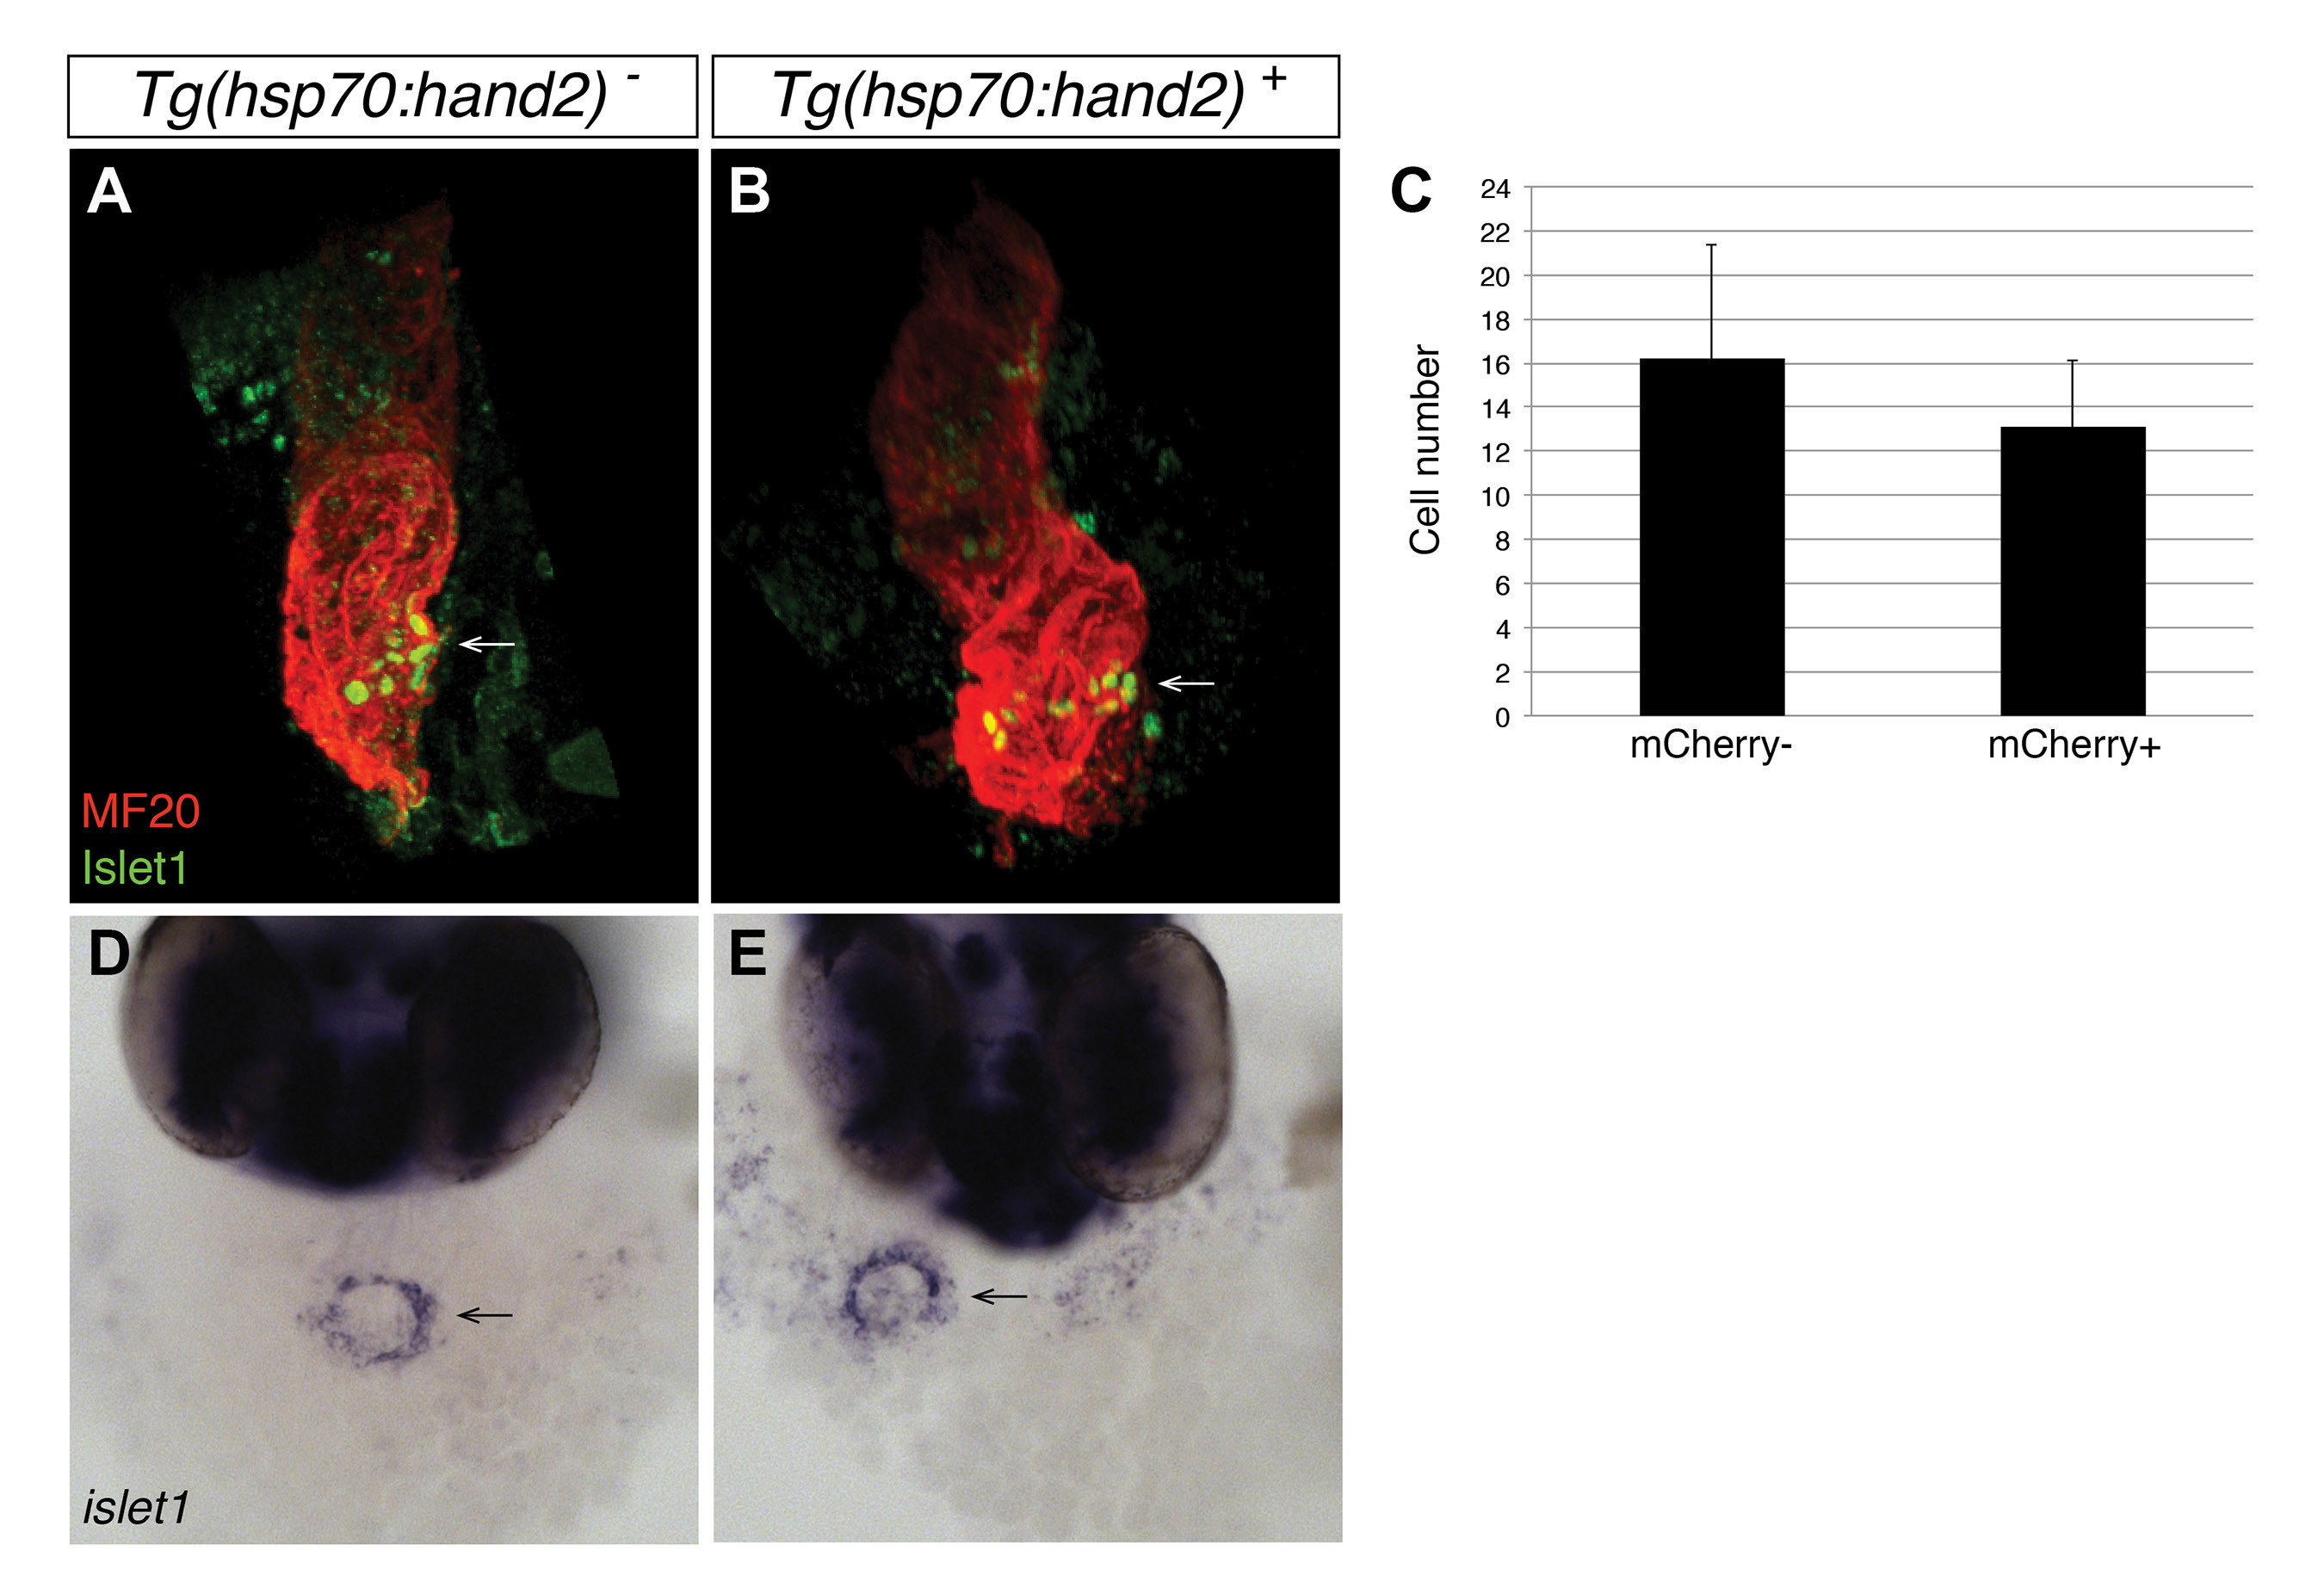
Fig. S4
Normal islet1 expression at the venous pole in embryos overexpressing hand2. (A-B) Immunofluorescence at 36 hpf for MF20 (red, visible throughout the heart) and Islet1 (green, visible in the nuclei of a subset of atrial cells). Frontal views, dorsal to the top; arrows point to the Islet1-positive population at the venous pole of the atrium. Following heat shock at 10 hpf, the population of Islet1-positive cells at the venous pole appears similar in hearts from (A) nontransgenic embryos and (B) Tg(hsp70:hand2) embryos. (C) Bar graph compares average number of Islet1-positive cardiomyocytes at 36 hpf in nontransgenic embryos and Tg(hsp70:hand2)embryos, following heat shock at 10 hpf. Error bars indicate standard deviation; no significant difference is observed between these two data sets (n=12, p=0.09). (D-E) In situ hybridization depicts islet1 expression at 36 hpf, following heat shock at 10 hpf. Frontal views, dorsal to the top; arrows point to the ring of islet1-expressing cells at the venous pole of the atrium. Expression patterns are similar in (D) nontransgenic embryos and (E) Tg(hsp70:hand2) embryos.

