
Image
|
Figure Caption
Fig. S1
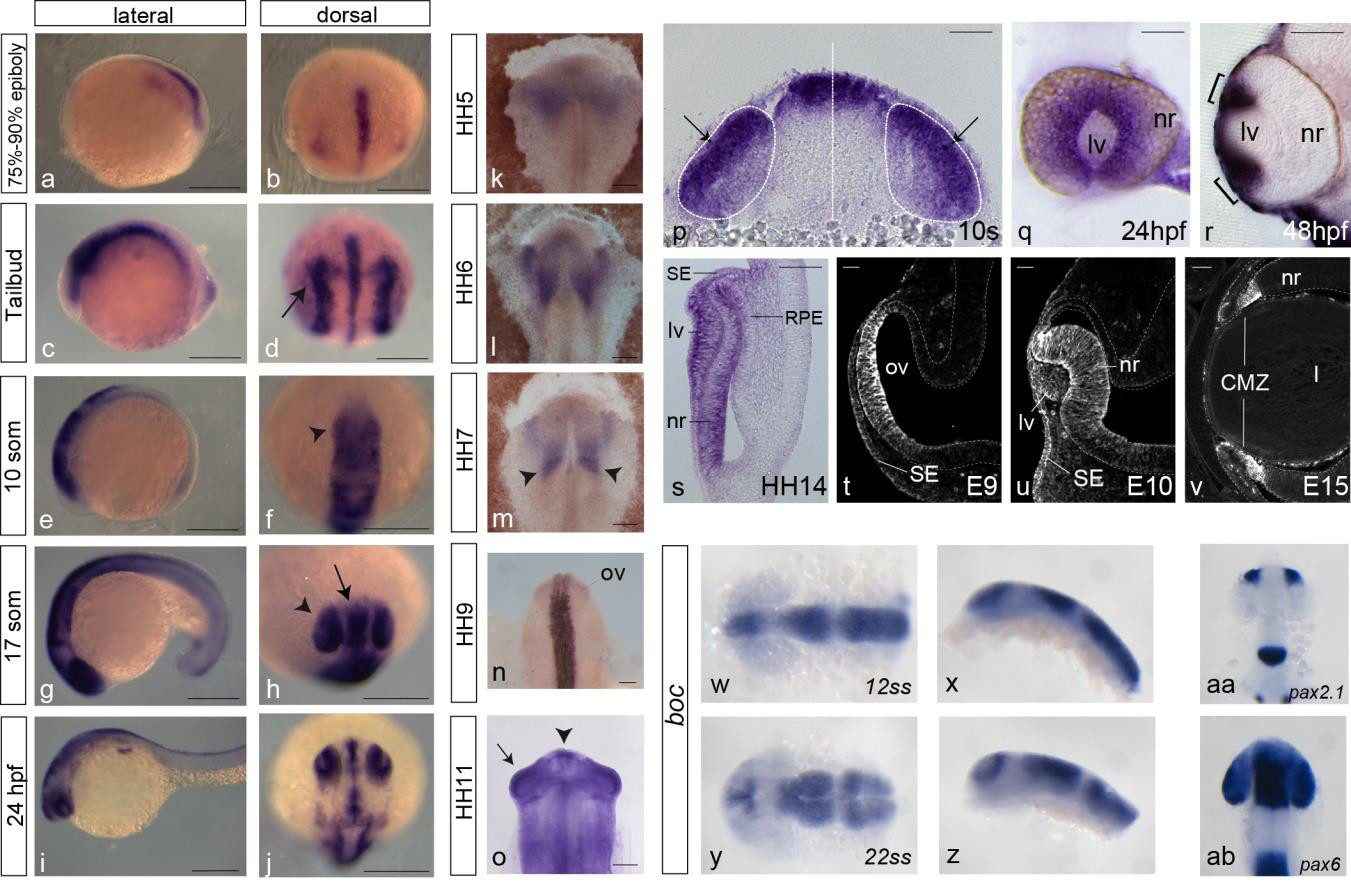
Cdon expression in vertebrate embryos.
Lateral (a-i) and dorsal (b-j) views of zebrafish and ventral (k-m) and dorsal (n, o) views of chick embryos at different developmental stages hybridized in toto with a Cdon specific probe and immunohistochemistry of Cdon distribution in the developing mouse embryonic eye (t-v). The zebrafish distribution of boc (w-z), pax2.1 (aa) and pax6 (ab) is shown for comparison with embryos hybridized in toto with probes specific for cdon at different stages of development. Images in (p, r) are coronal cryostat sections of zebrafish embryos hybridized in toto. In zebrafish at 75-90% epiboly cdon transcripts are detected in the ventral midline (a, b). At tailbud stage cdon mRNA localizes to the presumptive neural crest (c, d arrow) and at 10-17 somite stages in the optic vesicles (f, h arrowhead), prechordal plate, telencephalon (h, arrow) and dorsal neural tube (e-h). At 24 hpf cdon expression becomes restricted to the retina and the dorsal neural tube (i, j). In chick embryos, Cdon expression is first detected at the Hensen�s node (k), and later in the presumptive neural crest (l-n), somites (m arrowheads) and CNS (n). At HH11 Cdon mRNA localizes to the optic vesicles and dorsal CNS (o, arrow and arrowhead respectively). Cdon expression is restricted to regions of the telencephalon and the presumptive retinal domain of the optic vesicle at 10ss stage (p) to finally restricting to the ciliary margin zone (CMZ) (see brackets in q, r). Cdon expression in the developing eye is conserved in chick (s) and mouse embryos (t-v). Note that boc is not expressed in the optic vesicle (w, x) or the optic cup (y, z). The white dashed lines in p indicate the midline and the optic vesicles. The white dashed line in t-v delineates the neural epithelium. CMZ, ciliary marginal zone; l, lens; lv, lens vesicle; nr, neural retina; ov, optic vesicle; RPE, retinal pigmented epithelium; SE, surface ectoderm. Scale bars: 200 μm.
Figure Data
Acknowledgments
This image is the copyrighted work of the attributed author or publisher, and
ZFIN has permission only to display this image to its users.
Additional permissions should be obtained from the applicable author or publisher of the image.
Full text @ Nat. Commun.