
Image
|
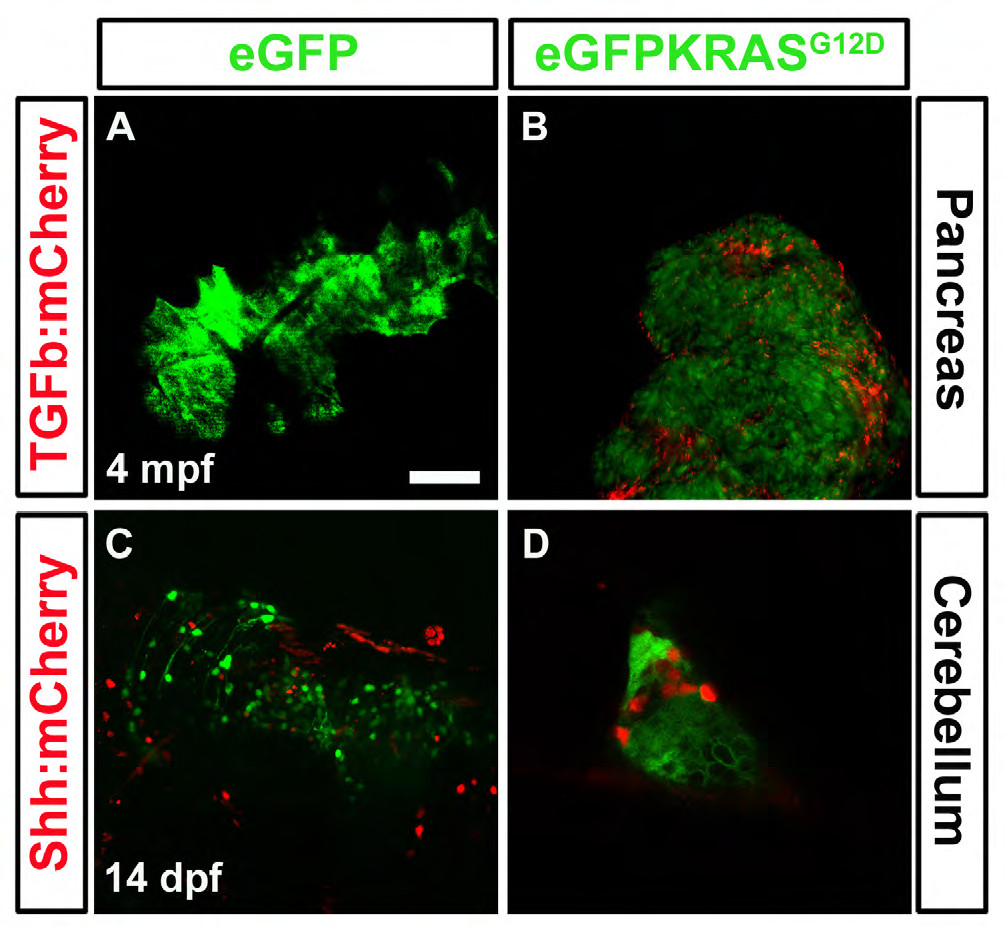
Figure Caption
Fig. S6
Role of TGFβ and Shh pathways during cancer progression. Panels A and C represent the Tg(ptf1a;eGFP) controls while panels B and D represent eGFPKRASG12D positive tumor masses. High levels of TGFβ:mCherry expression in the stroma around pancreatic tumor mass at 4 mpf are depicted in panel (B). Shh:mCherry is highly expressed in cerebellum at 14 dpf (D). All figures are single confocal Z-stack planes. Normal tissues and tumor masses are in green, while activity of Shh and TGFβ are in red. Scale bar is 50 μm.
Acknowledgments
This image is the copyrighted work of the attributed author or publisher, and
ZFIN has permission only to display this image to its users.
Additional permissions should be obtained from the applicable author or publisher of the image.
Full text @ Dis. Model. Mech.