Fig. 4
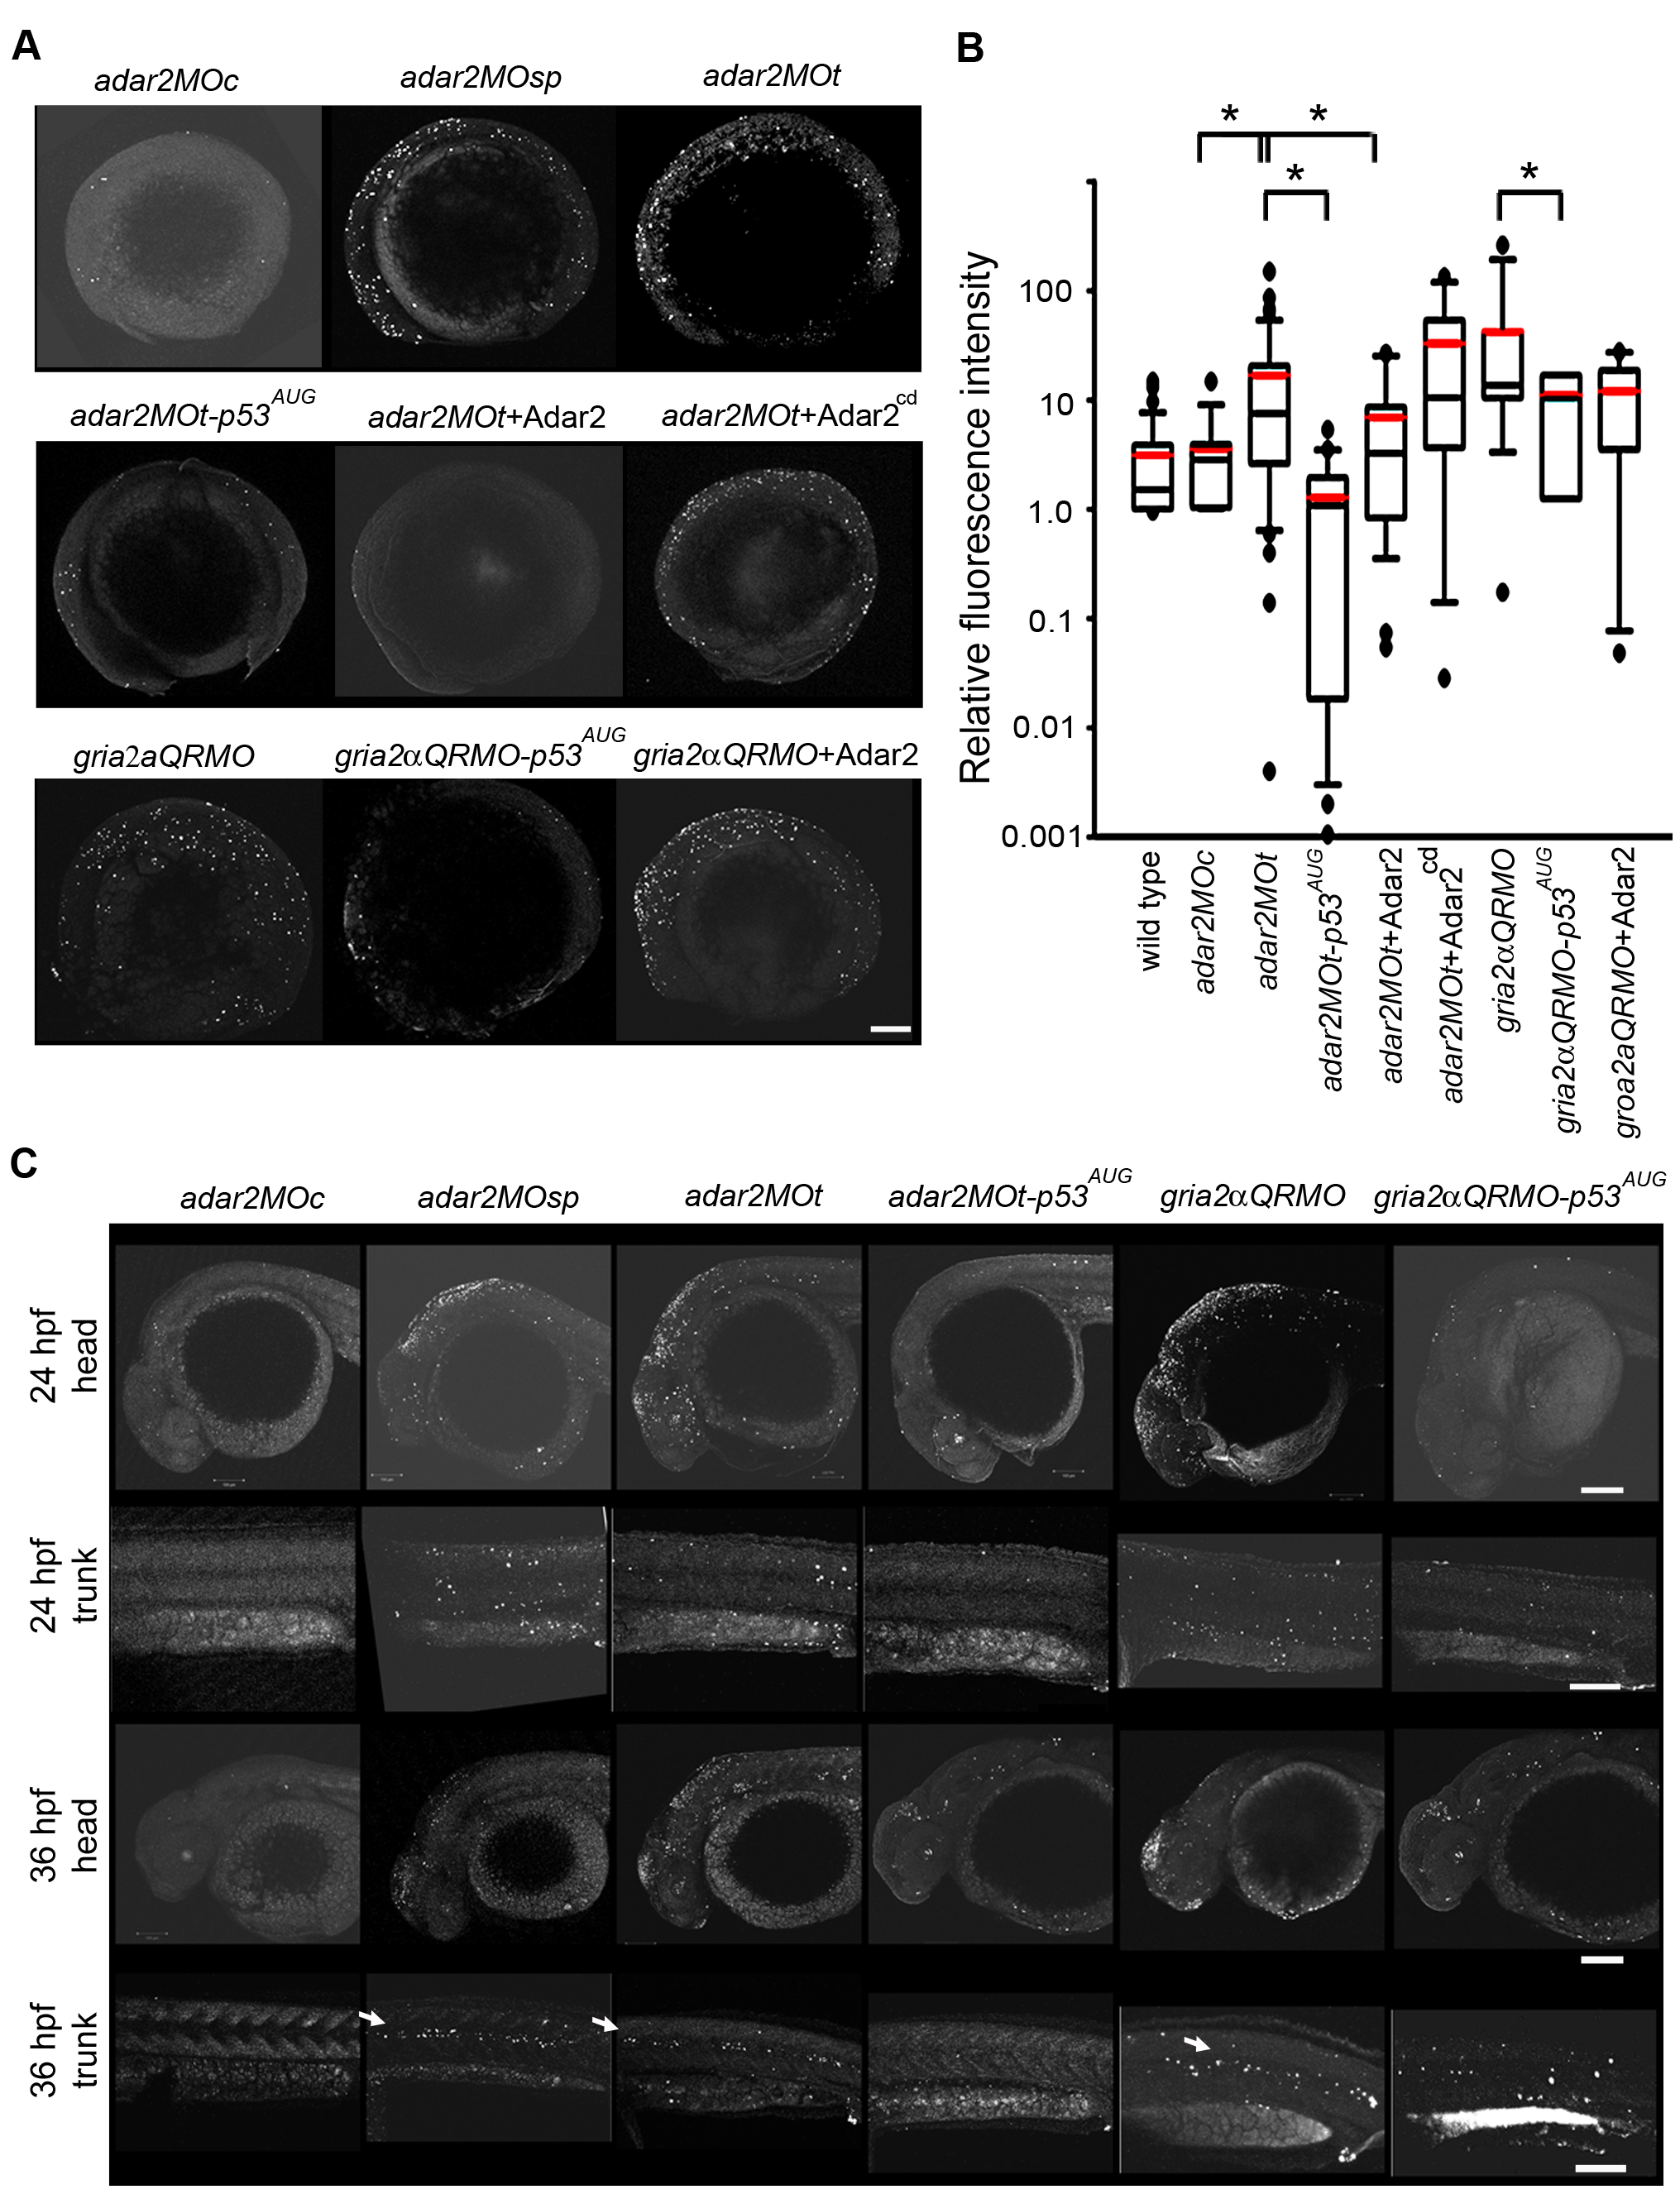
Increased p53-dependent apoptosis in the hypo-Q/R-editing morphants.
(A) Apoptosis at the 5-somite stage. Representative images, except those co-injected with p53-MOAUG, were selected from the ones showing the mean fluorescence intensities in the TUNEL (terminal deoxynucleotidyl transferase-mediated dUTP nick end-labeling) analysis. The anterior is to the left, and dorsal side is to the top. Top panel shows the adar2MOc, adar2MOsp and adar2MOt. Middle panel shows adar2MOt co-injected with p53AUG morpholino to block p53 activity, with adar2 cRNA (Adar2) and with adar2cd cRNA (Adar2cd). The bottom panel shows gria2αQRMO, and the gria2αQRMO co-injected with p53AUG and with adar2 cRNA. (B) Tukey box plot of the relative TUNEL signals at 5-somite stage. Boxes represent 50% inter quartile values. Black and red lines respectively mark the median and mean intensities. Outliers are marked as dots. All signals were normalized to a wild-type embryo, showing mean intensity, stained in the same batch (relative fluorescence intensity). The total embryos included in the analysis are 8 adar2MOc (2 batches), 42 adar2MOt (9 batches), 19 adar2MOt-p53 AUG (3 batches), 20 adar2MOt+Adar2 (3 batches), 12 adar2MOt+Adar2cd (3 batches), 9 gria2αQRMO (3 batches), 7 gria2αQRMO-p53AUG (3 batches) and 5 gria2αQRMO+ Adar2 (2 batches). (C) Increased p53-dependent apoptosis in specific regions of the 24- and 36-hpf hypo-Q/R-editing morphants. Lateral views of head and trunk at 24 and 36 hpf. Arrows indicate the apoptotic cells along the horizontal myoseptum. Scale bars represent 100 μm.

