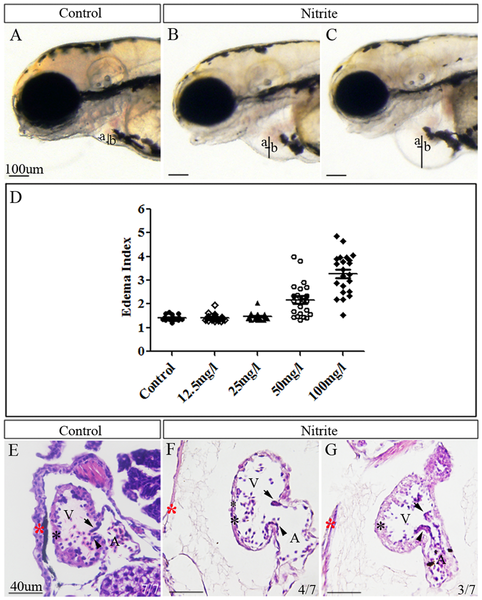
Fig. 1 Sodium nitrite caused defective development of zebrafish heart in a dose dependent way.
(A?C) Zebrafish embryos exposed to 100 mg/l sodium nitrite from 10 hpf exhibited cardiac edema from slight phenotype (B) to severe phenotype (C) compared to control embryos with normal heart (A) at 108 hpf. (D) A scatter plot showing the edema index (EI) of embryos exposed with different concentration of sodium nitrite. EI is defined as b/a. Average ± standard errors of EIs were shown in lines. (E?G) Histological sections showing 100 mg/l sodium nitrite exposure caused defective structure of zebrafish heart at 108 hpf. Compared to control embryos with normal pericardial membrane, myocardium and both superior and inferior valve leaflets (E), 4/7 embryos exposed to the nitrite showed thinner pericardial membrane and myocardium, and only superior valve leaflet but no formation of inferior valve leaflet (F), whereas 3/7 of the treated embryos displayed thinner pericardial membrane and myocardium and no formation of either superior or inferior leaflets (G). a: the semi-diameter of ventricle; b: the semi-diameter of the pericardial cavity. Red star (*): pericardial membrane; Black star (*): myocardium; Black arrow: position of superior valve leaflet; Black arrowhead: position of inferior valve leaflet; A: atria; V: ventricle.

