Fig. 4
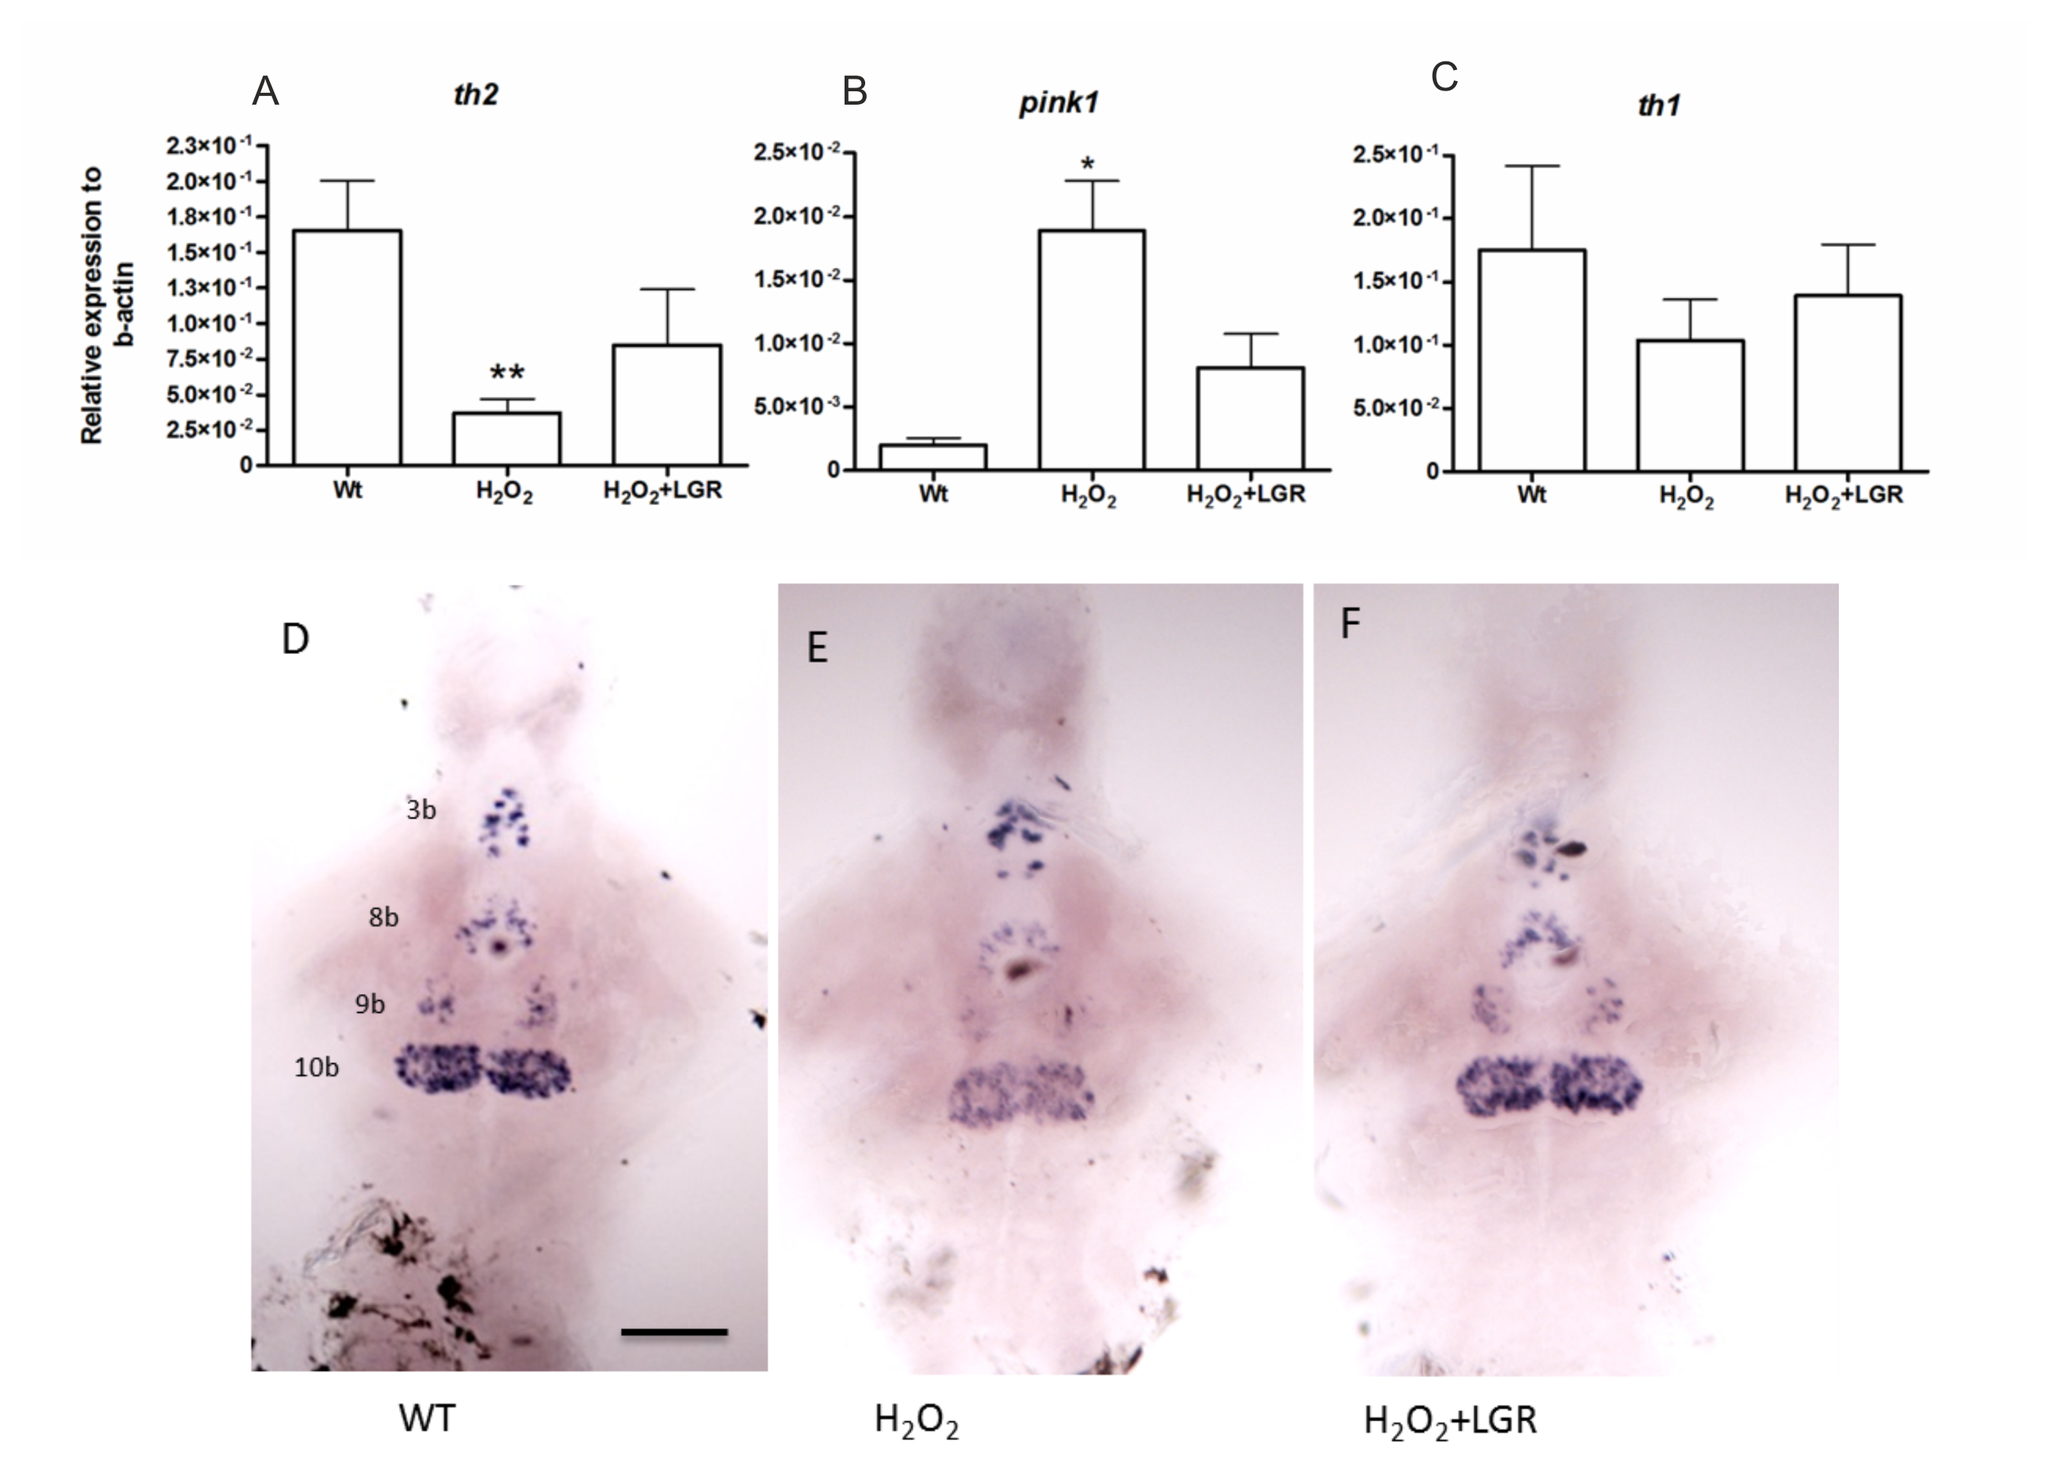
In-situ hybridization and q-RT-PCR at 3dpf in wild type fish following treatment with H2O2 and H2O2+LGR.
A. The th2 transcript levels significantly decreased in the H2O2 treated samples, verified by q-RT-PCR.
B. The pink1 transcript levels increased significantly in the H2O2 treated as compared to wild type samples.
C. No significant change in the th1 transcript levels was detected between the groups. Only a declining trend was observed.
Unpaired t-test (* p-value < 0.05, ** p-value< 0.01).
D-F. The expression of th2 mRNA is reduced in group 10b of the 7-dpf H2O2-treated fish as compared with untreated control fish. In the LGR-treated groups at 8 dpf, the decrease in th2 mRNA expression was prevented. The th2-expressing neuron groups 3b, 8b, 9b, 10b are identified according to [26].
Scale bar represents 100 μM. th1 – tyrosine hydroxylase1, th2 – tyrosine hydroxylase 2, pink1 – PTEN-induced putative kinase 1.

