Fig. 1
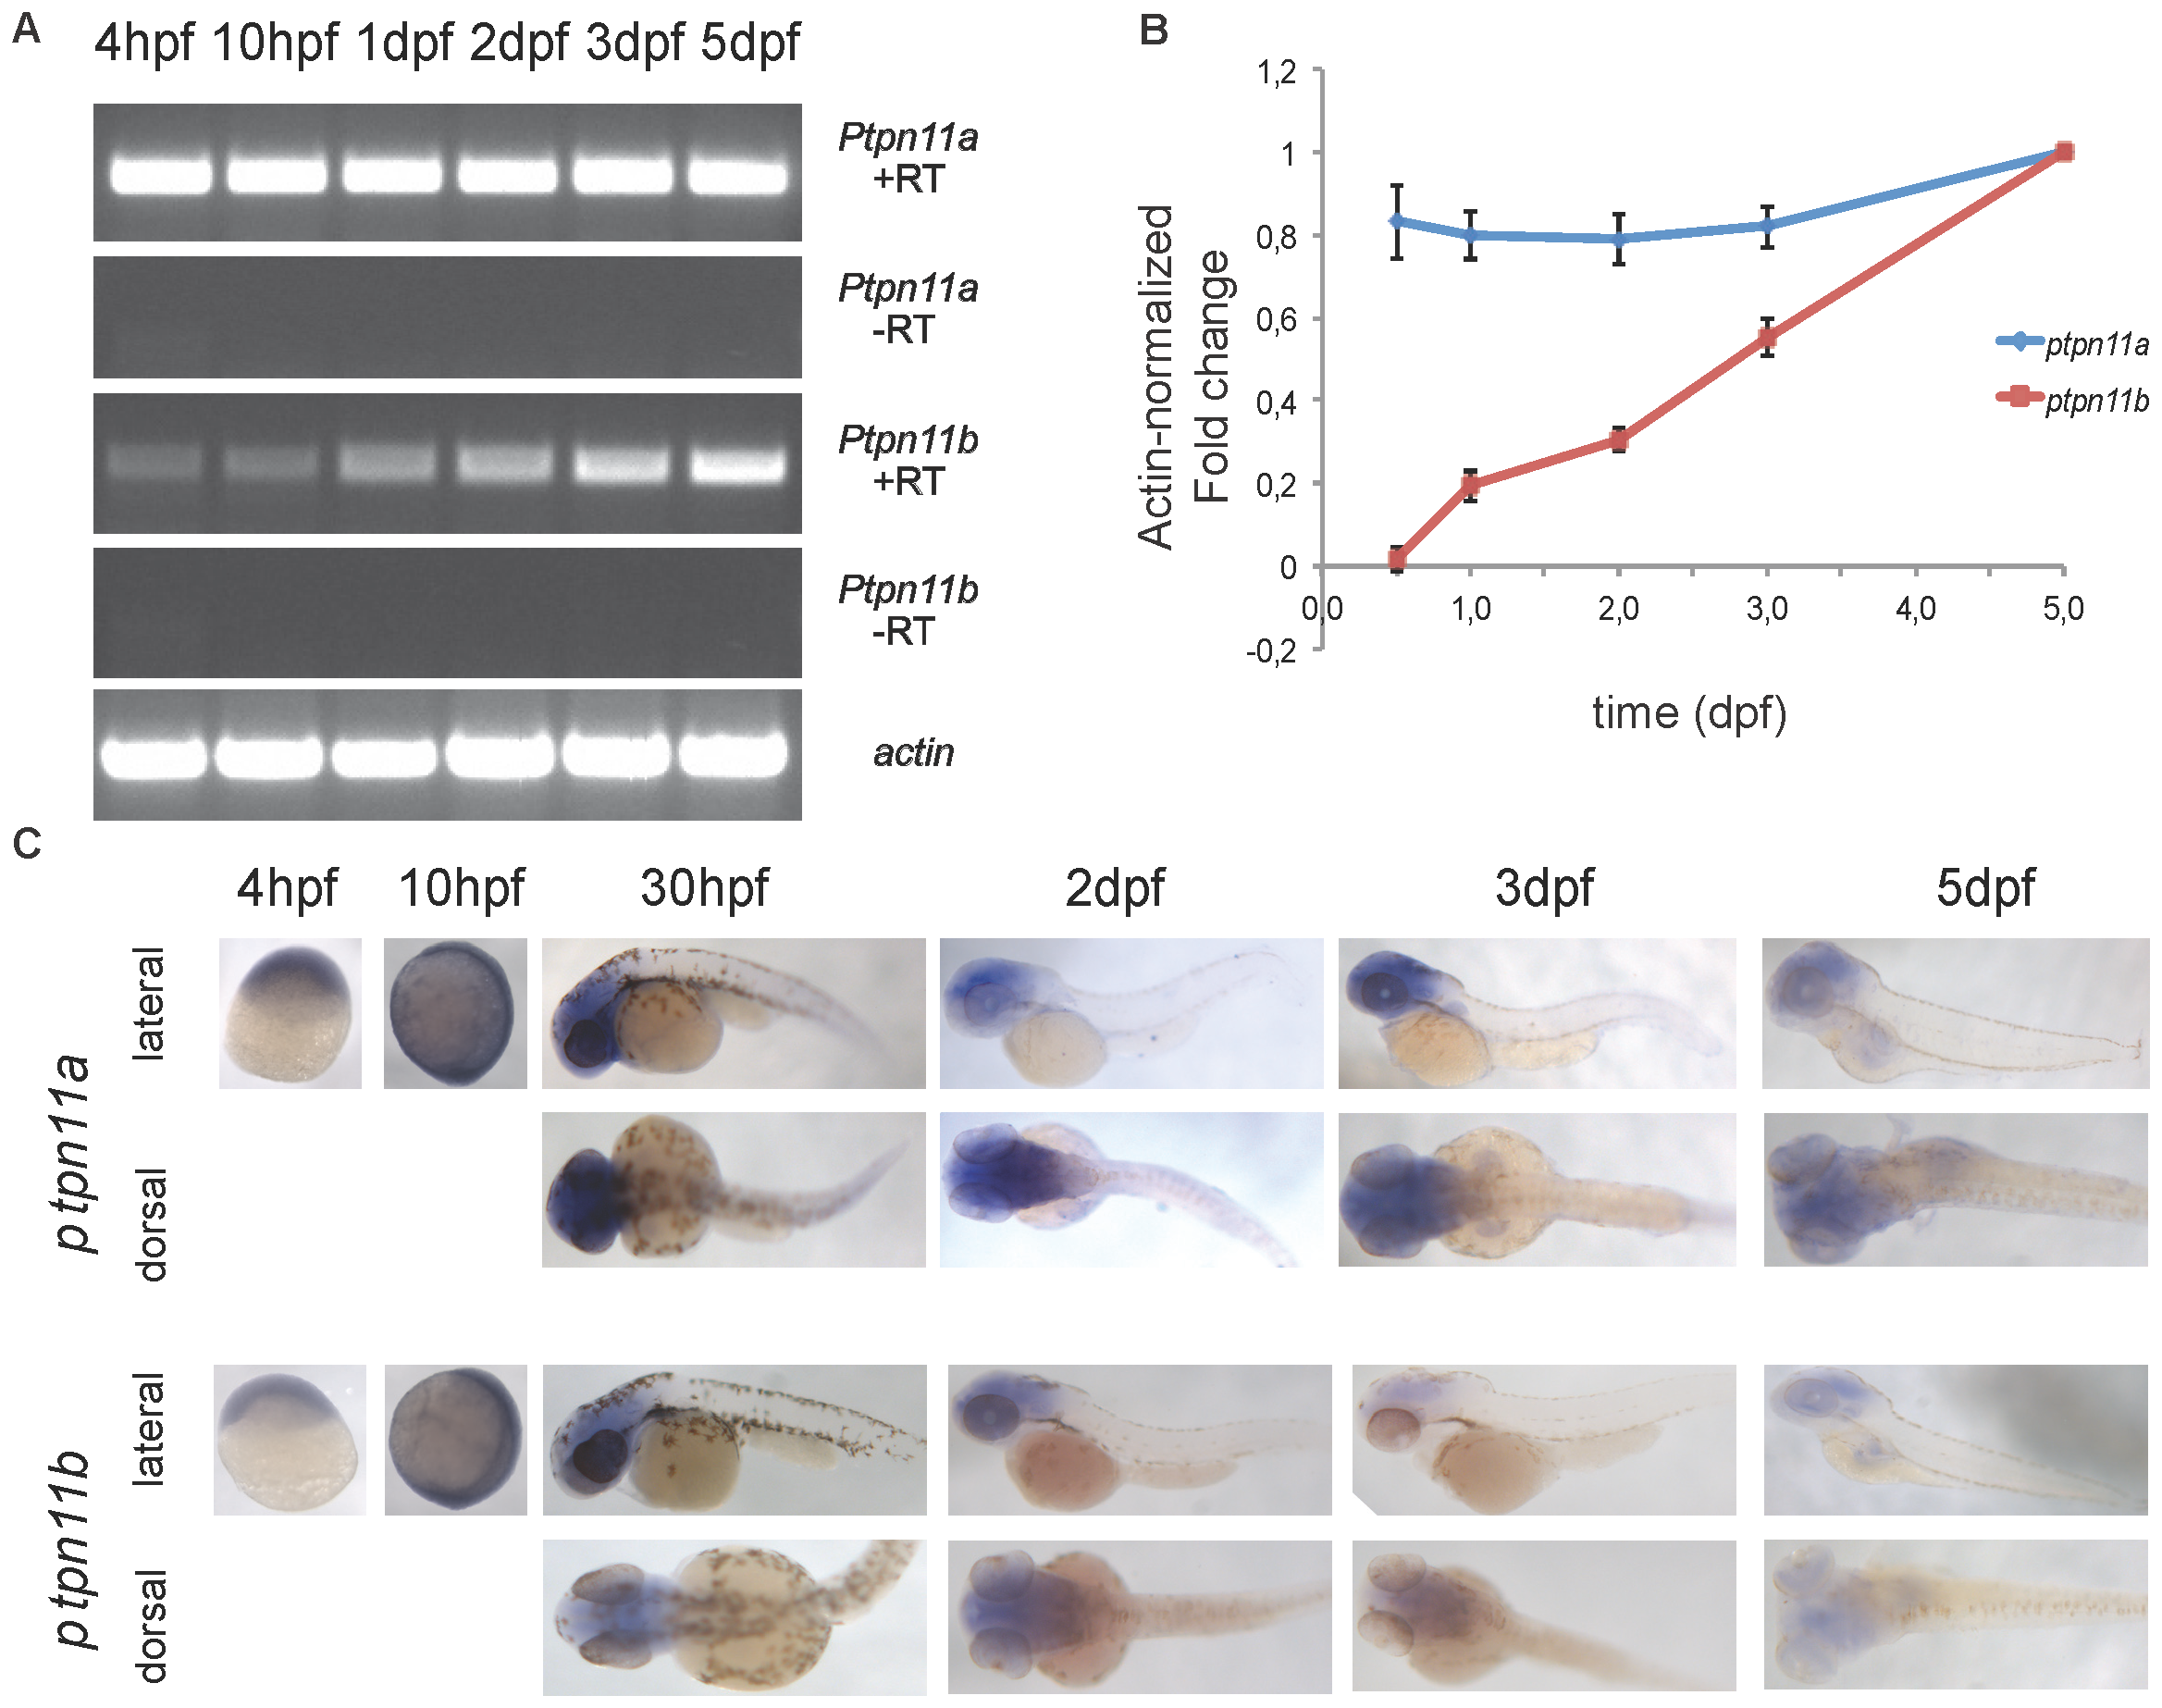
Expression of zebrafish ptpn11a and ptpn11b mRNA during embryogenesis.
(a) RNA was isolated from zebrafish embryos at 4 hpf, 10 hpf, 1 dpf, 2 dpf, 3 dpf and 5 dpf. Reverse transcription PCR was performed to detect the indicated genes; reverse transcriptase was omitted from the reaction as a control (-RT). (b) Quantitative PCR for ptpn11a and ptpn11b gene expression was performed from a pool of wild-type embryos (n = 30) collected at 10 hpf, 1 dpf, 2 dpf, 3 dpf and 5 dpf. The values were normalized using Actin as a control and relative expression is depicted here (value at 5 dpf set to 1.0). Error bars indicate standard error of the mean. (c) Whole-mount in situ hybridization using ptpn11a and ptpn11b specific probes of 4 hpf, 10 hpf, 30 hpf, 2 dpf, 3 dpf and 5 dpf embryos. Lateral and dorsal views are given as indicated.

