Fig. 4
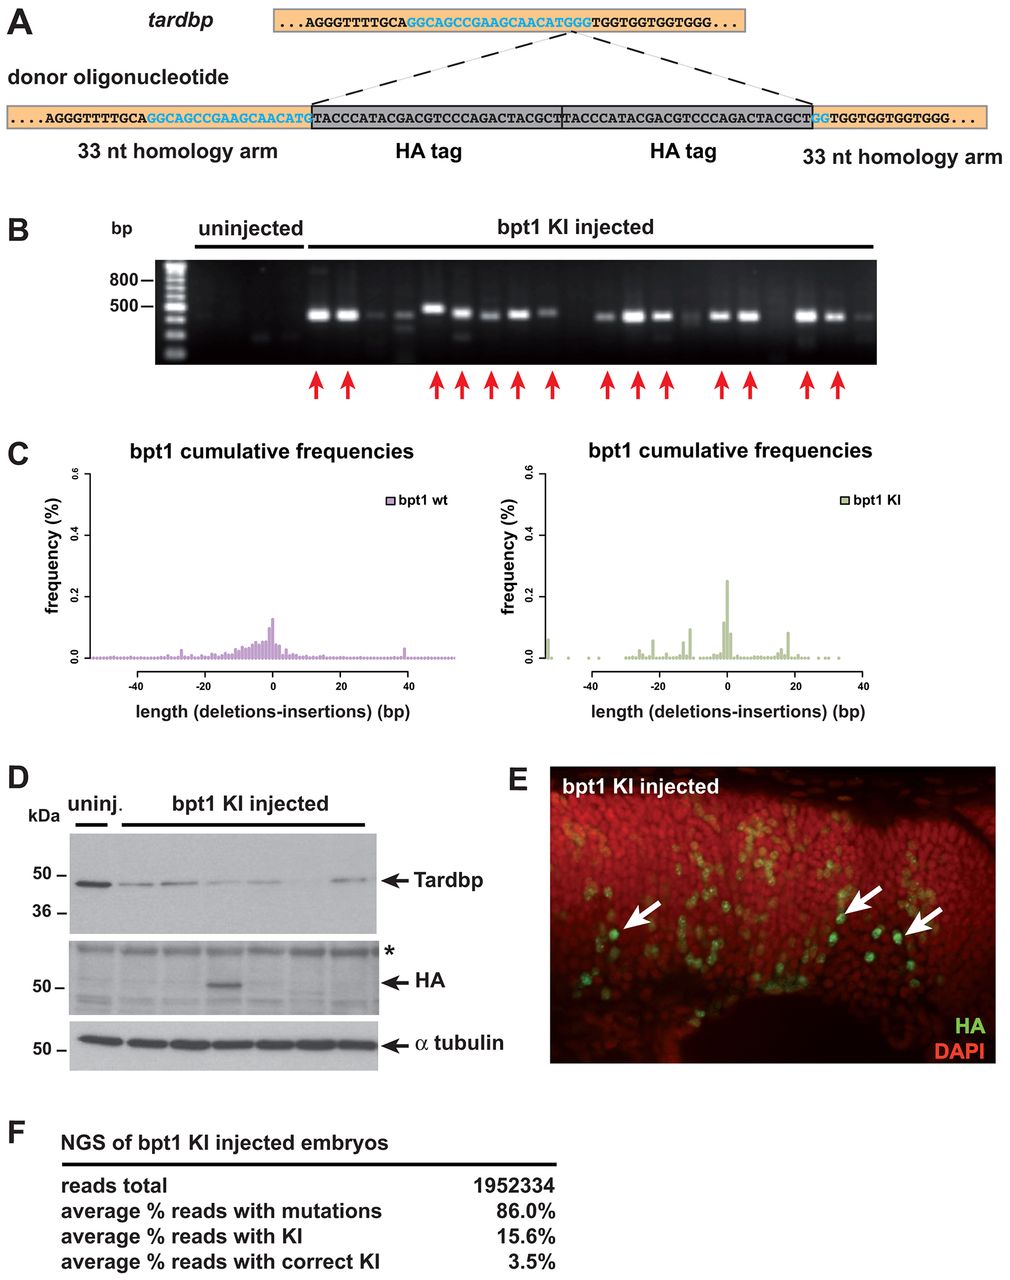
HA tag knock-in at the bpt1 locus. (A) The KI strategy at the bpt1 locus. (B) PCR analysis of KI injected embryos. Red arrows indicate successful genomic integration of the HA tag derived from the donor oligonucleotide. (C) Average frequencies of NGS reads of ten bpt1 KI embryos mapped to wild-type (left) and KI reference (right) sequence. Negative values are deletions and positive values are insertions. (D) Western blot analysis of bpt1 KI embryos with antibodies against Tardbp, HA and α-tubulin. Asterisk indicates unspecific bands. (E) Immunohistochemistry of 2 dpf bpt1 KI injected embryos with antibodies against the HA epitope (green) counterstained with DAPI (red). Arrows indicate HA-positive nuclear staining. (F) Summary of NGS data for the bpt1 KI analysis.

