
|
Fig. 5
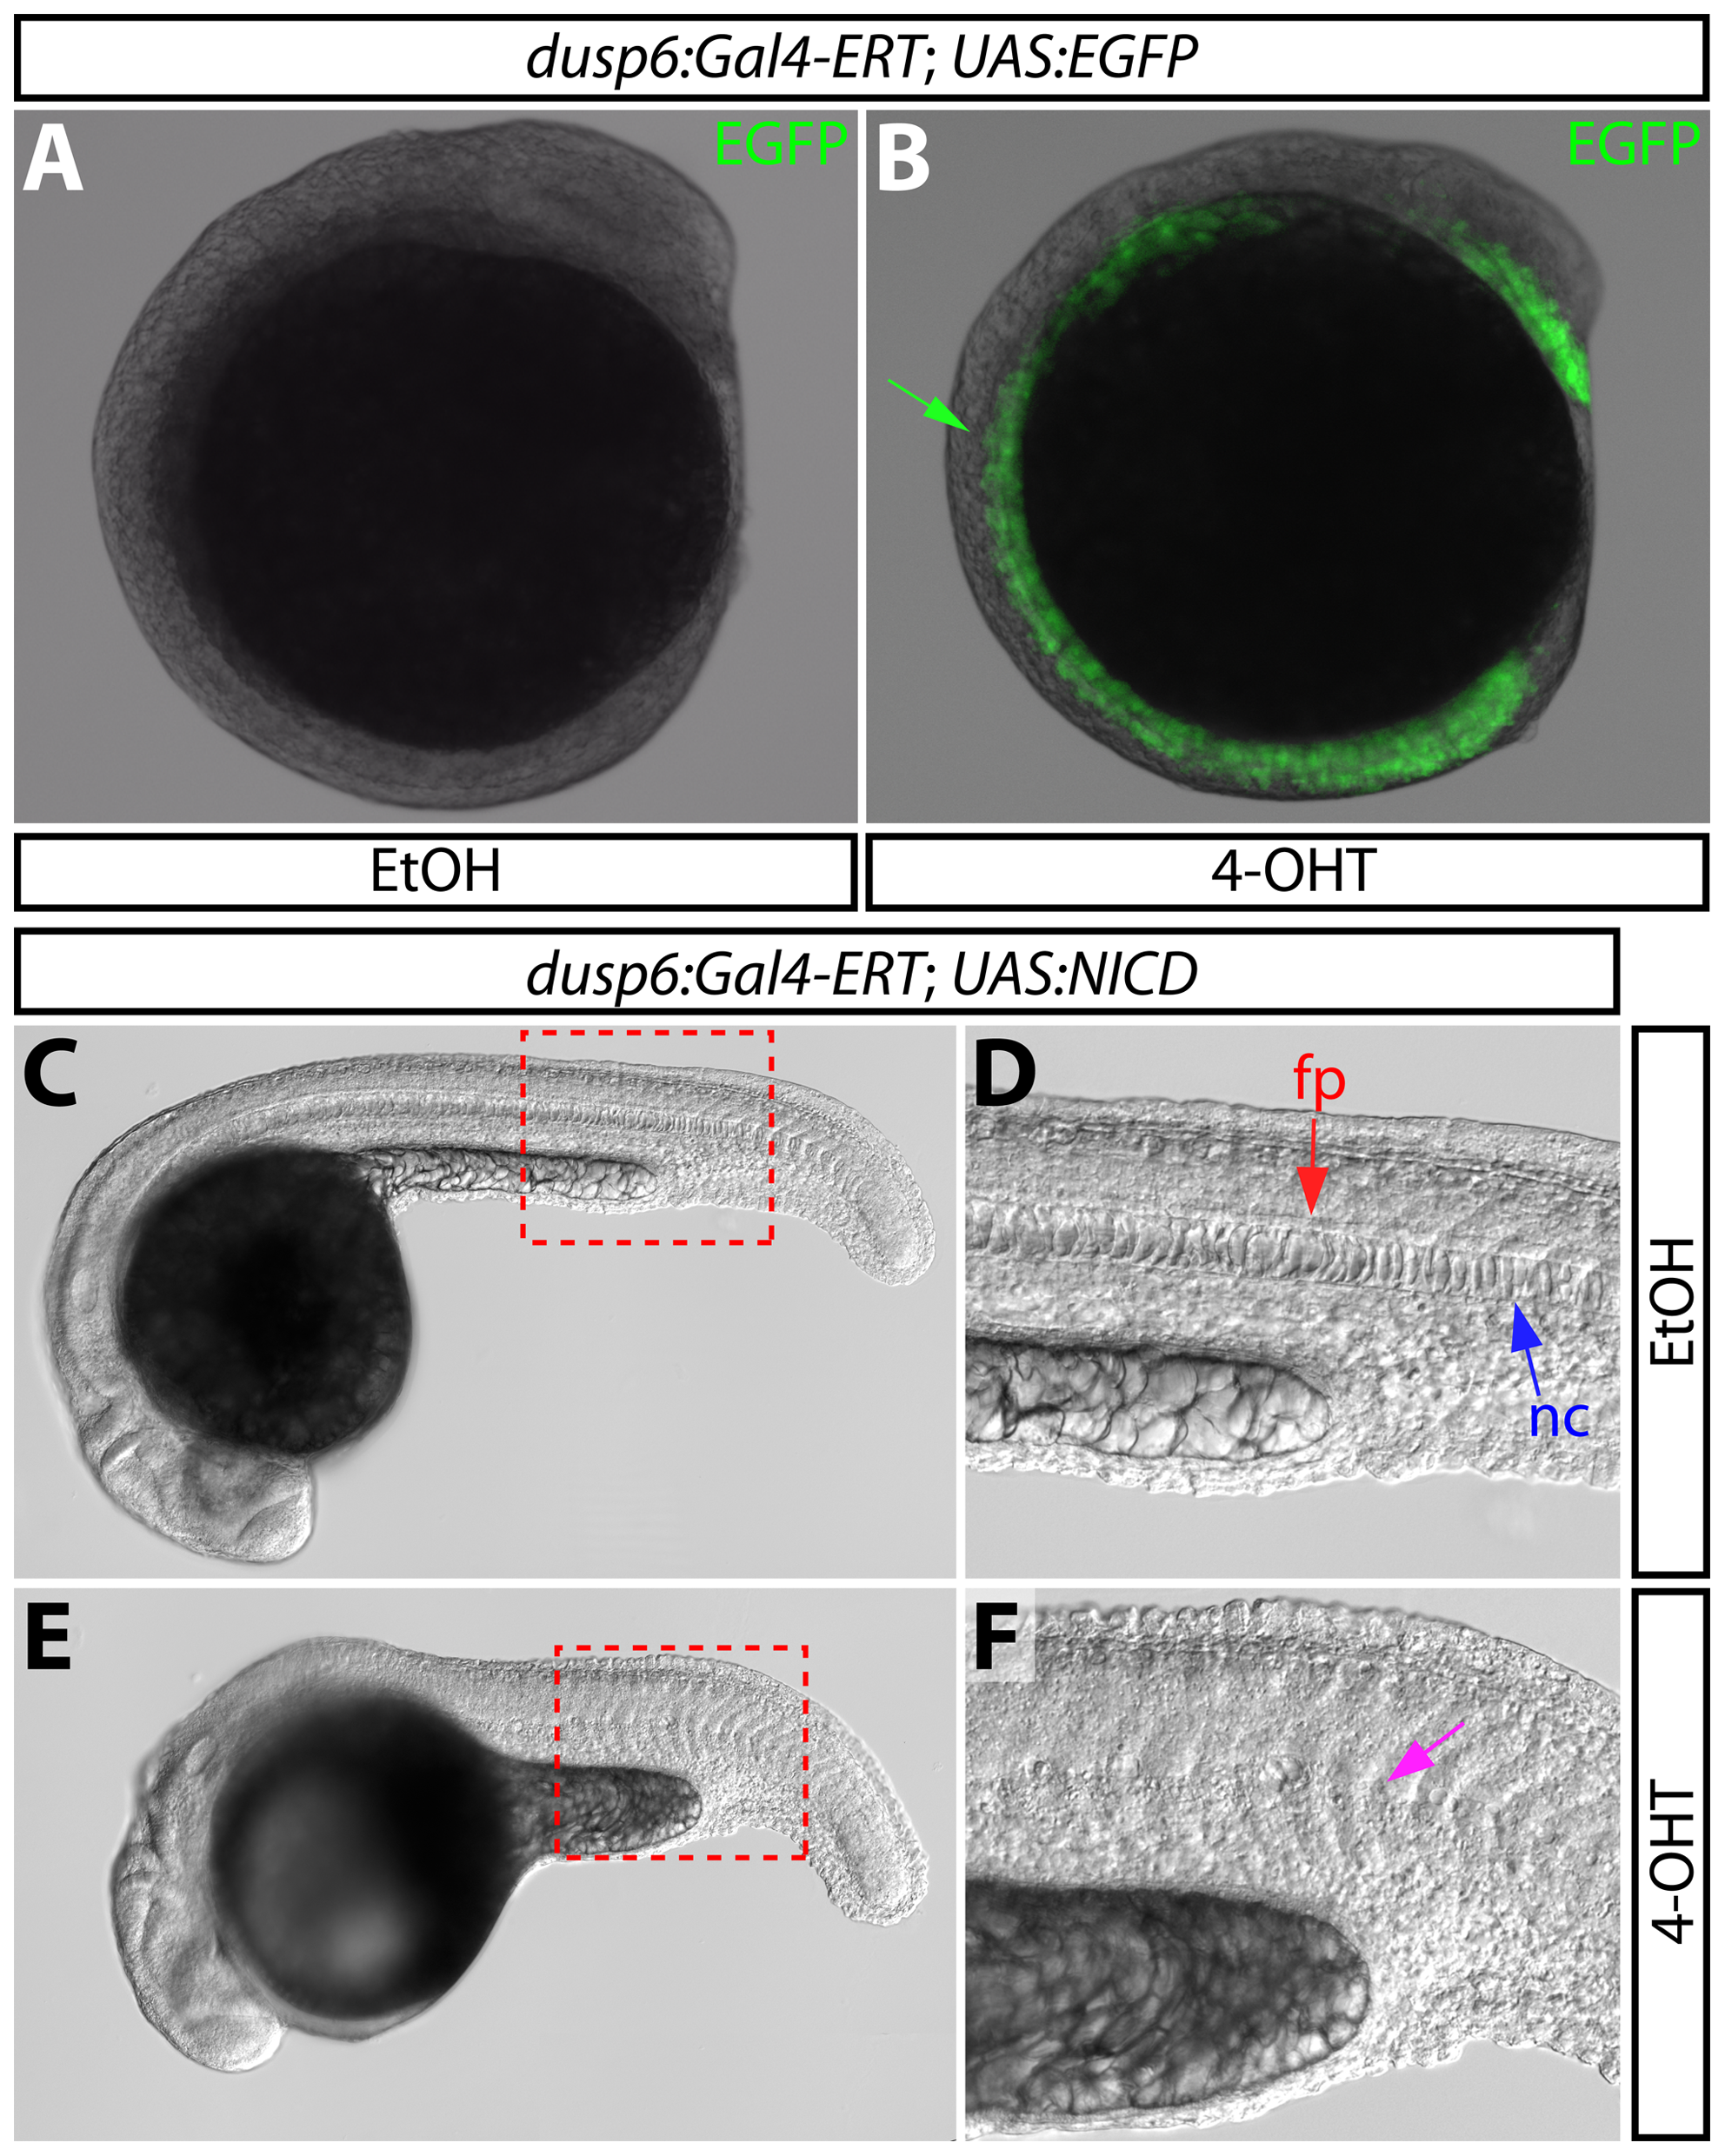
Overexpression of the Notch1 intracellular domain using the dusp6:Gal4-ERT driver disrupts notochord development.
(A and B) EGFP expression at the 10-somite stage in control (A) and 2 μM 4-OHT treated Tg(dusp6:Gal4-ERT-VP16; UAS:EGFP) fish. The green arrow points to EGFP expression at the midline. (C–F) DIC images of control (C and D) and 4-OHT treated (4 μM from 2–24 hpf, E and F) Tg(dusp6:Gal4-ERT-VP16; UAS:NICD) animals at 24 hpf. Regions bounded by the dashed red box in panels C and E are shown in high magnification in panels D and F, respectively. In panel D, the red arrow indicates the floor plate (fp) and the blue arrow indicates the notochord (nc); in panel E, the magenta arrow highlights the reduced notochord and disorganized floor plate.