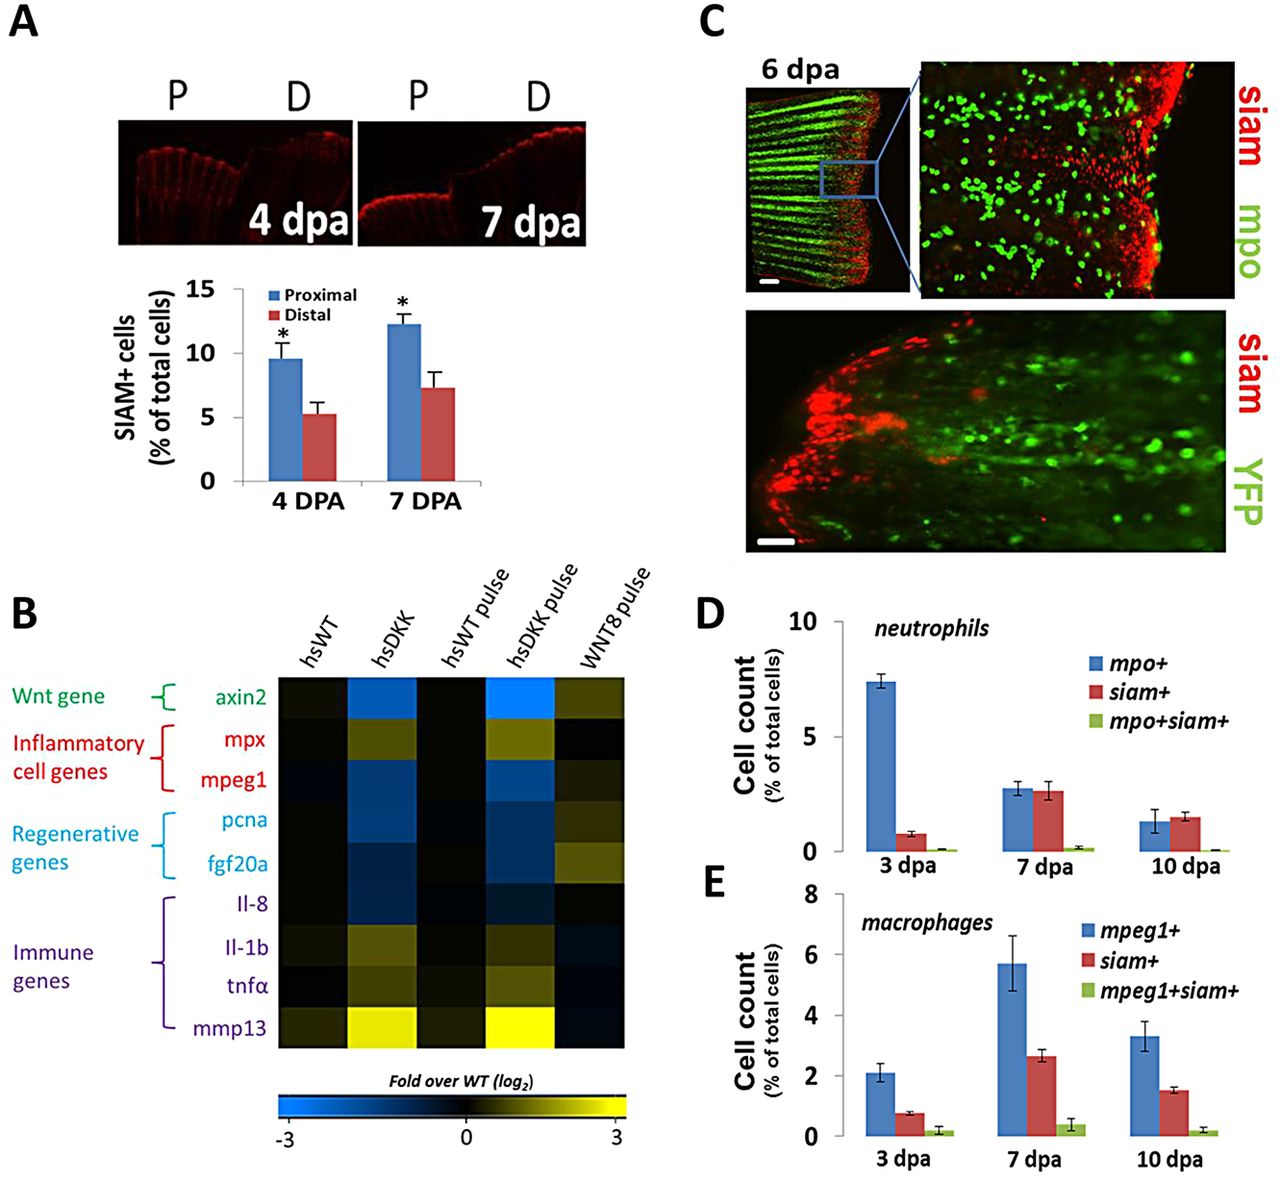
Fig. 6
Wnt/β-catenin signaling by non-leukocytes affects the injury environment in regenerating fins. (A) Representative images detailing cells undergoing Wnt/β-catenin signaling (siam+, red) for proximal and distal fin resections in Tg(TCFsiam:mCherry) fish. Siam+ cell number is increased in proximal cuts. 4dpa, *P=0.0329; 7dpa, *P=0.0296 (two-tailed t-test, error bars indicate s.e.m.). (B) Gene expression levels (4dpa) of pooled blastemal fin tissue (n>5) as assessed by qRT-PCR for wild-type and for the Tg(hsDKK1:GFP) loss-of-function and Wnt8a (hsWnt8a:GFP) gain-of-function Wnt/β-catenin signaling fish lines. Levels were normalized to fold over non-heat shock control. Data were averaged over two separate experiments. One group included daily heat shock following amputation; the other group included a single heat shock pulse at 84hpa with tissue extraction 12h later at 4dpa. mpx is mpo. (C) Representative images of distal resections from Tg(mpo:GFP; TCFsiam:mCherry) fish and Tg(mpeg1:NTR-YFP; TCFsiam:mCherry) fish at 6dpa. Little colocalization is evident between neutrophils (mpo+) and siam+ cells. Scale bar: 40Ám; 100Ám in bottom panel. (D) Quantification of flow cytometry sorted cells from pooled resected fins (n=8) from Tg(mpo:GFP; TCFsiam:mCherry) fish indicating the presence of few mpo+ siam+ cells. (E) Quantification of flow cytometry sorted cells from pooled resected fins (n=7) from Tg(mpeg1:NTR-eYFP; TCFsiam:mCherry) fish indicating the presence of few mpeg1+ siam+ cells. (D,E) Error bars indicate s.e.m. of the average of three experiments.

