Fig. 1
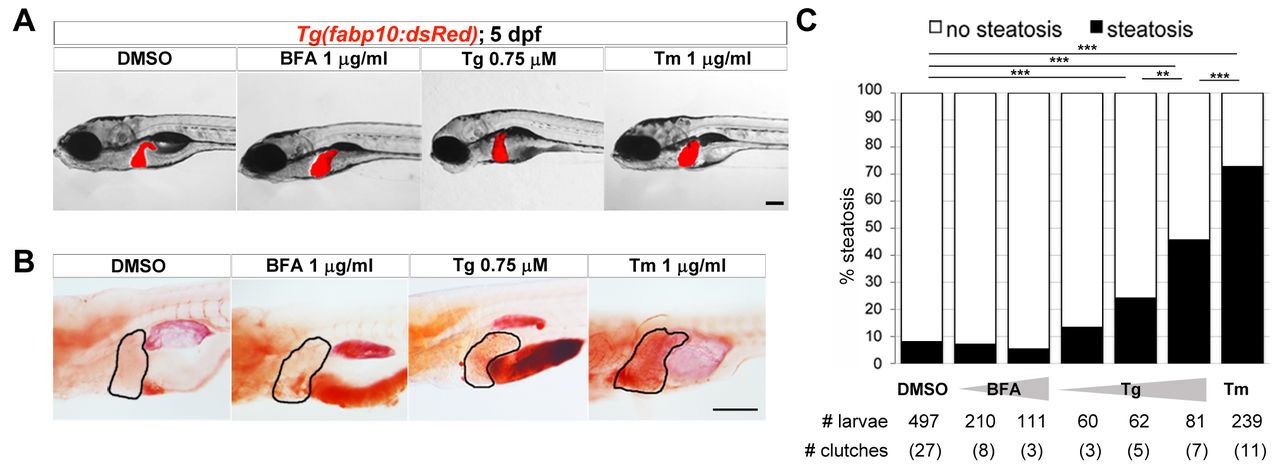
Tm is the only ER stressor that induces fatty liver. (A,B) Representative images of 5-dpf larvae treated for 48 hours with DMSO, BFA, Tg or Tm at the indicated concentrations. (A) Live transgenic Tg(fabp10:dsRed) larvae were imaged. (B) Fixed larvae were stained for neutral lipids with Oil Red O. Livers are circled. (C) Larvae treated with DMSO, 1 and 2 μg/ml BFA, 0.25, 0.5 and 0.75 μM Tg or 1 µg/ml Tm from 3-5 dpf were stained with Oil Red O and scored for the presence (black bars) or absence (white bars) of steatosis. The total number of larvae scored and the number of clutches are indicated. **P<0.01, ***P<0.0001, calculated using Fisher?s exact test. Scale bars: 200 μm (A), 1 mm (B).

