Image
Figure Caption
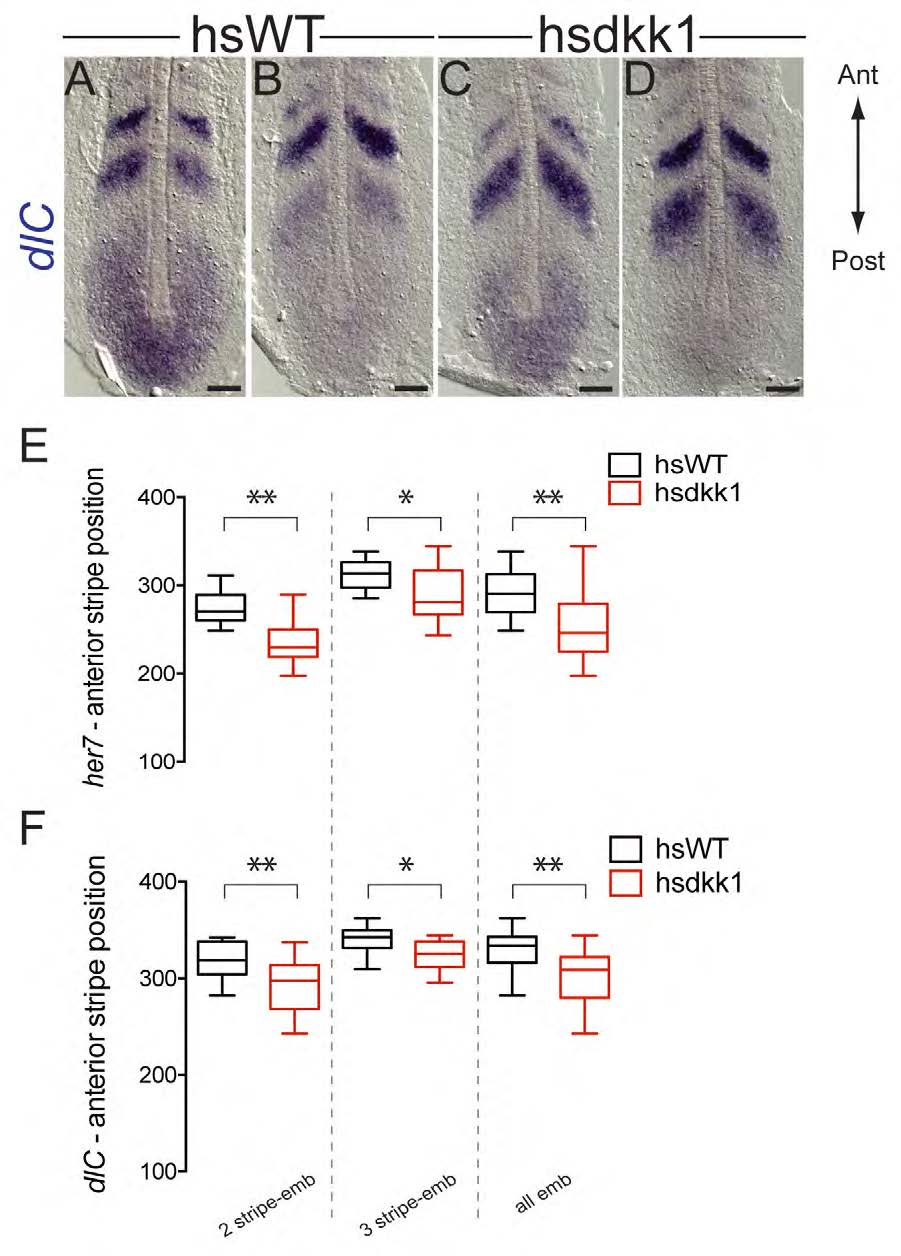
Fig. S2 Effect of Wnt inhibition on dlC and her7 expression at ~7 somites phs, related to Figure 3. (A-D) Dorsal views of flat-mounted PSM from hsdkk1::GFP (C,D) or their WT siblings (A,B) heat-shocked at 2 somites, fixed 3.5 h phs and stained for dlC. (E,F) Box Plot of the distance between anterior-most stripe of her7 (E) or dlC (F) and the posterior end of the notochord measured from embryos displaying 2 stripes or 3 stripes or both. * p<0.01, ** p<0.001. Scale bar 50Ám.
Acknowledgments
This image is the copyrighted work of the attributed author or publisher, and
ZFIN has permission only to display this image to its users.
Additional permissions should be obtained from the applicable author or publisher of the image.
Full text @ Development

