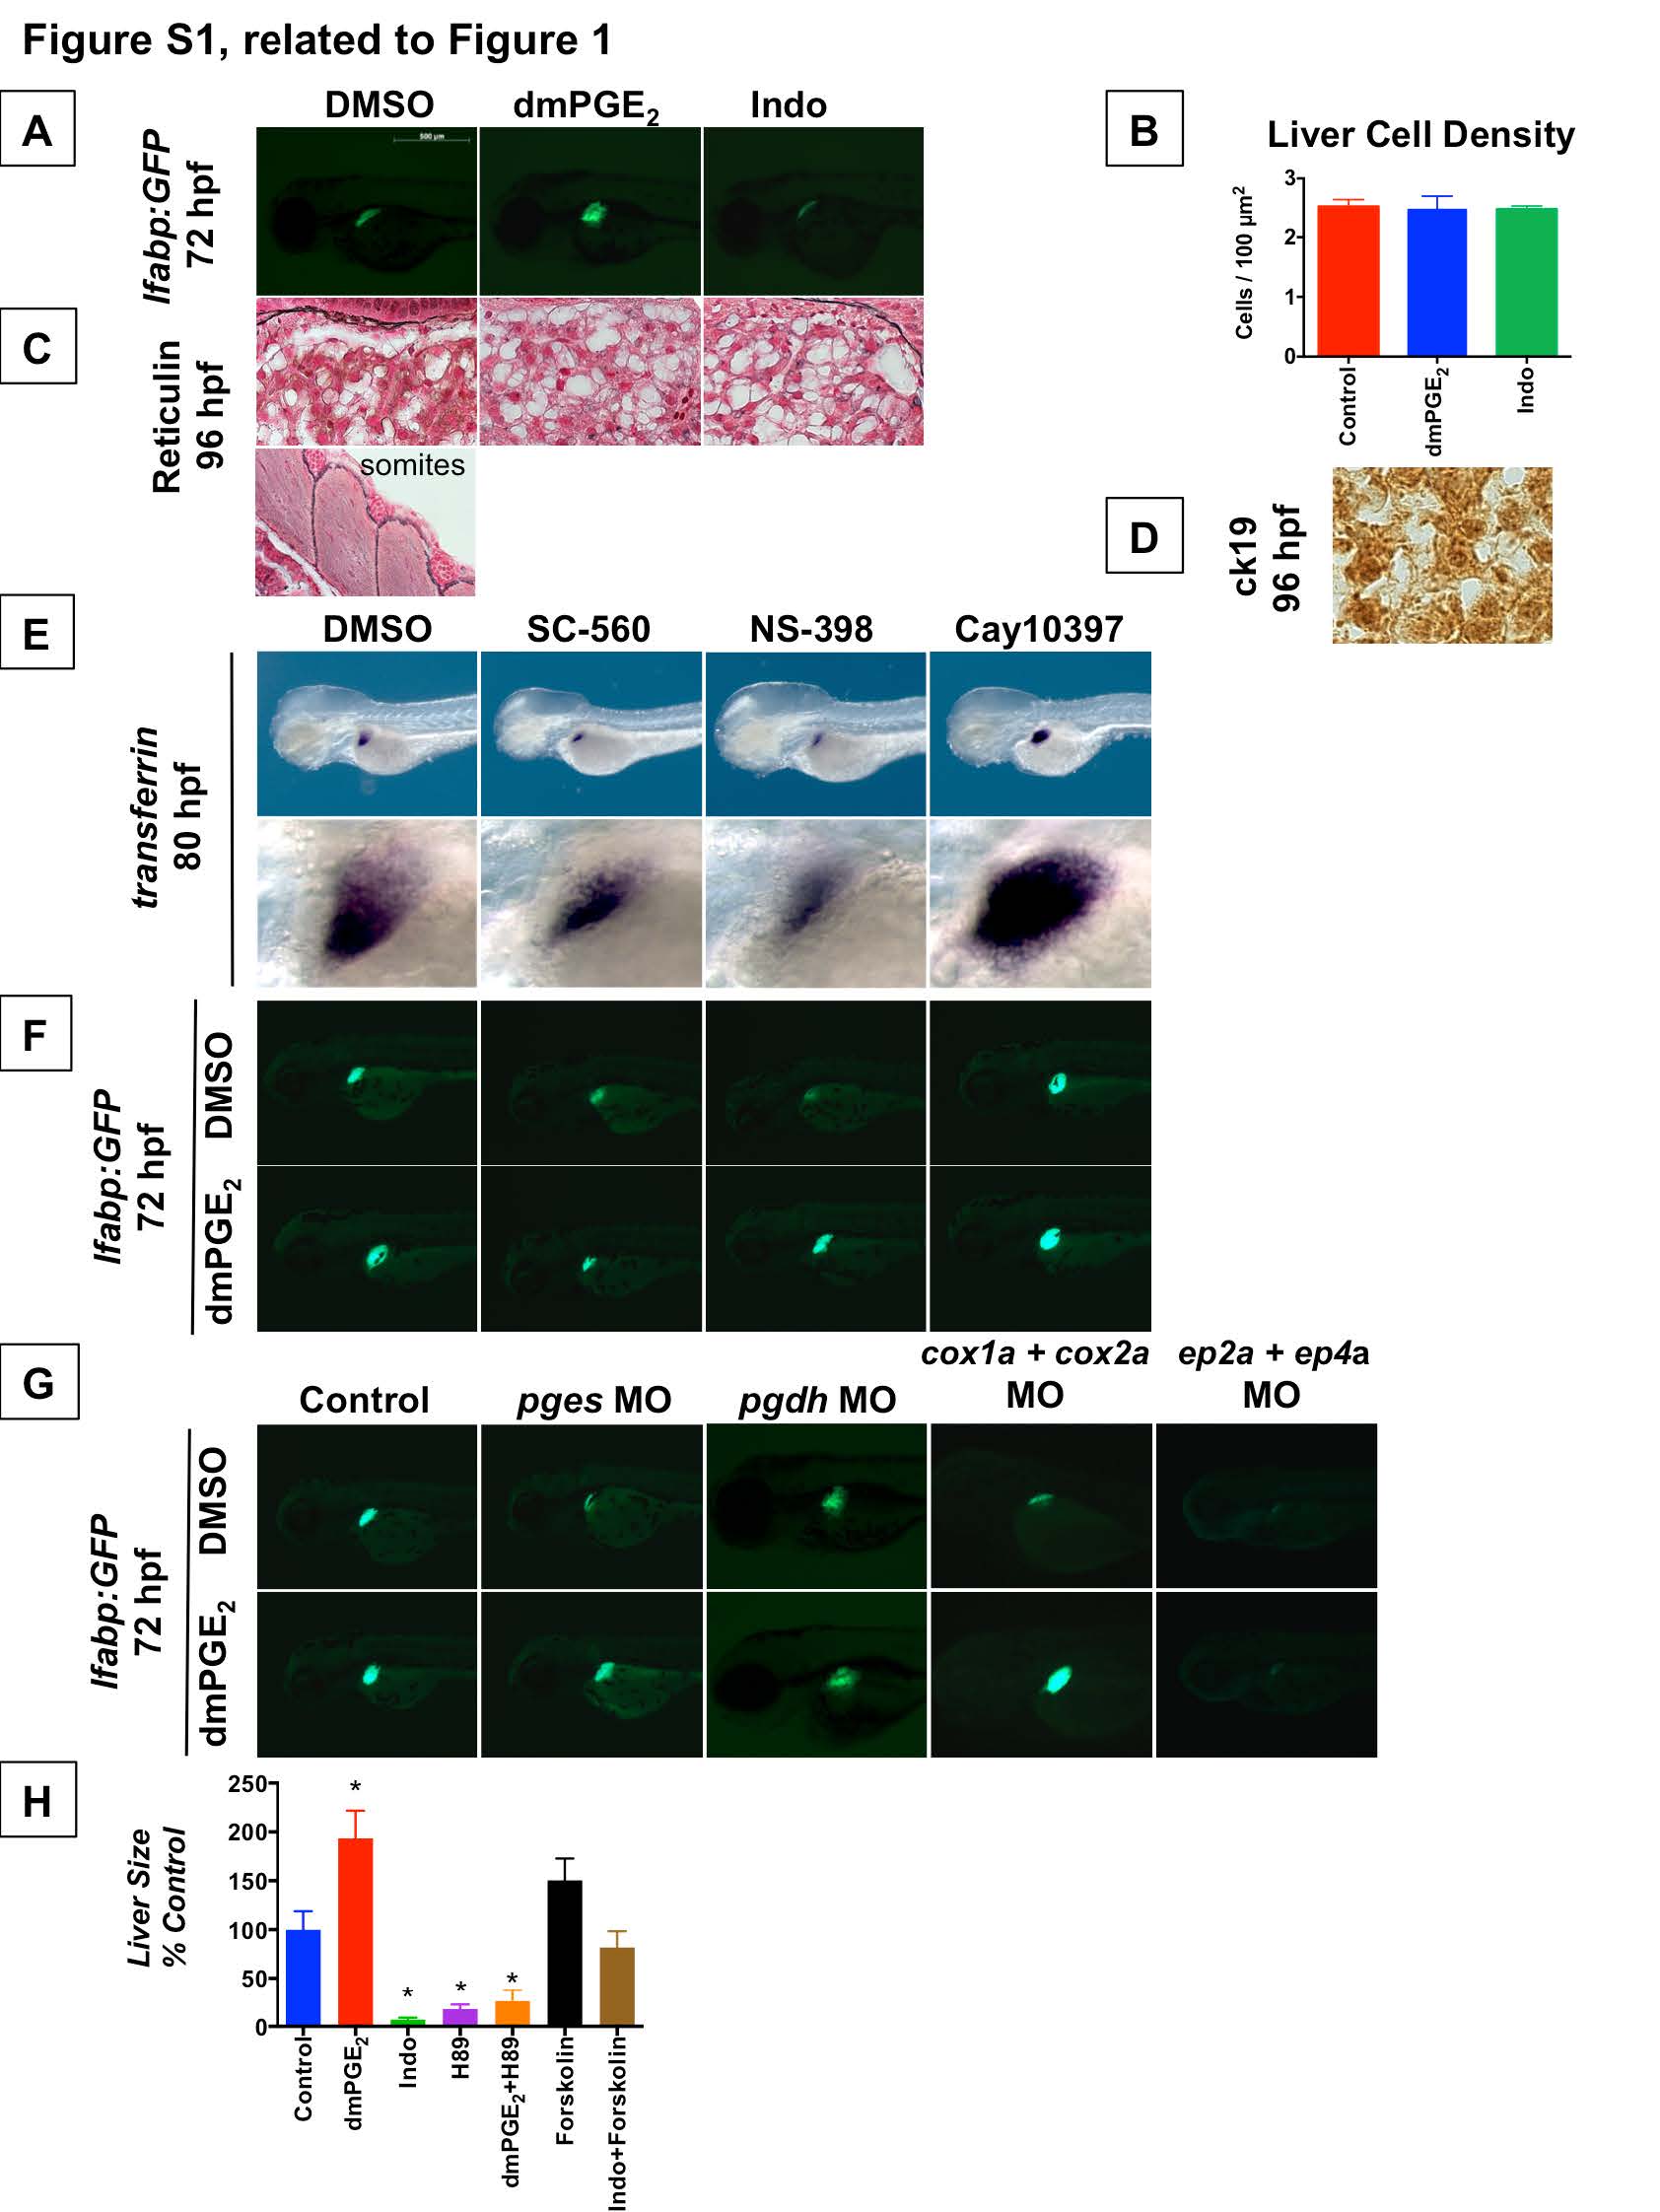
Fig. S1 PGE2 affects Liver Development (Related to Figure 1) (A) Analysis of liver size by GFP fluorescence in lfabp:GFP embryos at 72 hpf demonstrates that exposure to dmPGE2 from 48-72 hpf enlarges the liver whereas exposure to Indomethacin severely abrogates liver development (n > 30 each condition). Left lateral view. (B) Quantification of cell density (# nuclei / area) by nuclear counts visualized by DAPI staining. Liver cell density does not change significantly after pharmacologic modulation of prostaglandin activity. (Data are represented as mean ± SEM). (C) Reticulin staining to visualize liver histology at 96 hpf following treatment with dmPGE2 or Indo. Staining was performed and reviewed by a pathologist. As confirmation of the stain, a representative view of developing somites is shown, demonstrating specific staining of reticular fibers. No discernible differences in reticulin staining are observed in the developing liver following modulation of prostaglandin activity. (D) Representative view of ck19 immunohistochemistry of the developing liver at 96 hpf. Low levels of ck19 are broadly expressed in all treatment conditions. ck19 marks hepatobiliary ductal epithelium in the adult liver, but this ductal epithelium has yet to mature in the embryonic liver at 96 hpf. (E) Pharmacologic blockade of PGE2 synthetic enzymes results in a smaller developing liver, as visualized by in situ hybridization for the liver marker transferrin. A smaller embryonic liver results from blockade of cox1a with SC-560 (54.8% embryos with smaller liver, n = 17 / 31) or cox2a with NS-398 (48.5% embryos with smaller liver, n = 16 / 33). In contrast, pharmacologic blockade of PGE2 degrading enzyme prostaglandin dehydrogenase (pdgh) with Cay10397 results in a larger embryonic liver (43.8% embryos with larger liver, n = 14 / 32). Left lateral view, row below is magnified view. (F) Effects of pharmacologic blockade of PGE2 synthetic or degrading enzymes on liver development seen by in situ hybridization for transferrin were corroborated by GFP fluorescence in lfabp:GFP embryos. A smaller embryonic liver results from blockade of cox1a with SC-560 or blockade of cox2a with NS-398, and these effects were rescued by exogenous addition of dmPGE2. In contrast, blockade of pdgh with Cay10397 results in a larger embryonic liver (37.4% embryos with a larger liver, n = 18 / 48), and this effect is even more pronounced in the presence of exogenous dmPGE2 (53.6% embryos with a larger liver, n = 28 / 52). Left lateral view. (G) Morpholino-mediated knockdown of PGE2 synthetic and degrading enzymes or PGE2 receptors alters liver development, as visualized by GFP fluorescence in lfabp:GFP embryos. Knockdown of synthetic enzyme pges (prostaglandin E synthase) abrogates liver development, and this effect can be rescued by exogenous addition of dmPGE2. In contrast, knockdown of the PGE2 degrading enzyme pgdh (15-hydroxy prostaglandin dehydrogenase) enlarges the developing liver, and this effect is even more dramatic with addition of exogenous dmPGE2. Knockdown of both cox1a and cox2a synthetic enzymes severely abrogates liver development, and this effect can be partially rescued by addition of exogenous dmPGE2. Knockdown of both ep2a and ep4a receptors results in nearly complete loss of the developing liver, and this effect cannot be rescued by exogenous dmPGE2. (n > 30 per condition). Left lateral view. (H) Modulation of cAMP and PKA activity impacts liver outgrowth. Relative liver size was quantified by [area] x [fluorescence intensity] in lfabp:GFP embryos after exposure to dmPGE2 or Indo in the presence or absence of H89, a PKA inhibitor, or Forskolin, a cAMP activator, from 48-72 hpf. Inhibiting PKA activity with H89 resulted in a smaller embryonic liver, whereas augmenting cAMP activity with Forskolin resulted in a larger embryonic liver. The effect of dmPGE2 to augment liver size was blunted in the presence of H89, and the effect of Indo to diminish liver size was blunted in the presence of Forskolin. (Data are represented as mean ± SEM; n e 20; significant by unpaired t-test comparing treatment vs. control, * p<0.05).
Reprinted from Developmental Cell, 28(4), Nissim, S., Sherwood, R.I., Wucherpfennig, J., Saunders, D., Harris, J.M., Esain, V., Carroll, K.J., Frechette, G.M., Kim, A.J., Hwang, K.L., Cutting, C.C., Elledge, S., North, T.E., and Goessling, W., Prostaglandin E2 regulates liver versus pancreas cell-fate decisions and endodermal outgrowth, 423-437, Copyright (2014) with permission from Elsevier. Full text @ Dev. Cell

