
|
Fig. 7
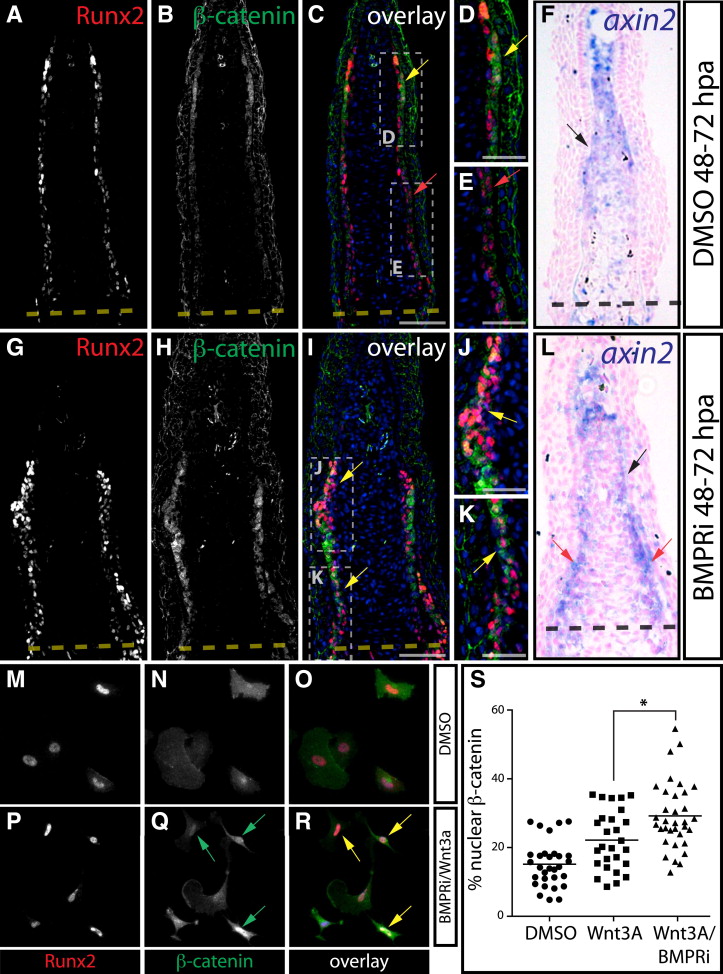
BMP Negatively Regulates Wnt/β-Catenin Signaling
(A–L) Immunostaining (A–E and G–K) with Runx2 (red) and β-catenin (green) antibodies and axin2 in situ hybridization (F and L) on sectioned fins from DMSO (A–F) and BMPRi-treated fish (G–L, 5 μM at 48–72 hpa). Yellow arrows highlight Runx2+ cells with nuclear-localized β-catenin, and red arrows point to osteoblasts with membrane-localized β-catenin. Hoechst-stained nuclei are in blue. For (F) and (L), axin2 expression (blue) in distal osteoblasts is indicated by black arrows. In (L), red arrows point to proximal axin2+ osteoblasts. Scale bars represent 50 μm (A–C and G–I) and 25 μm (D, E, J, and K).
(M–R) Runx2 expression (red) and β-catenin localization (green) in antibody-stained primary zebrafish fin osteoblasts grown in media containing DMSO (M–O) or BMPRi + Wnt3a (P–R, 300 nM and 40 ng/ml, respectively) for 24 hr beginning at 4 days postisolation. Green arrows point to cells with nuclear β-catenin localization, and yellow arrows indicate Runx2+ cells displaying nuclear β-catenin.
(S) Plots showing nuclear-localized β-catenin versus total cell β-catenin in Runx2+ cells in individual, randomly selected cultured fin osteoblasts following DMSO, Wnt3 (40 ng/ml), or BMPRi + Wnt3a (300 nM and 40 ng/ml, respectively) exposure. A line marks the mean of each group. The Wnt3a + BMPRi population displayed significantly increased nuclear β-catenin relative to the Wnt3A-alone-treated group as determined by one-way ANOVA and a post hoc Tukey’s test (p > 0.01, indicated by an asterisk).