
|
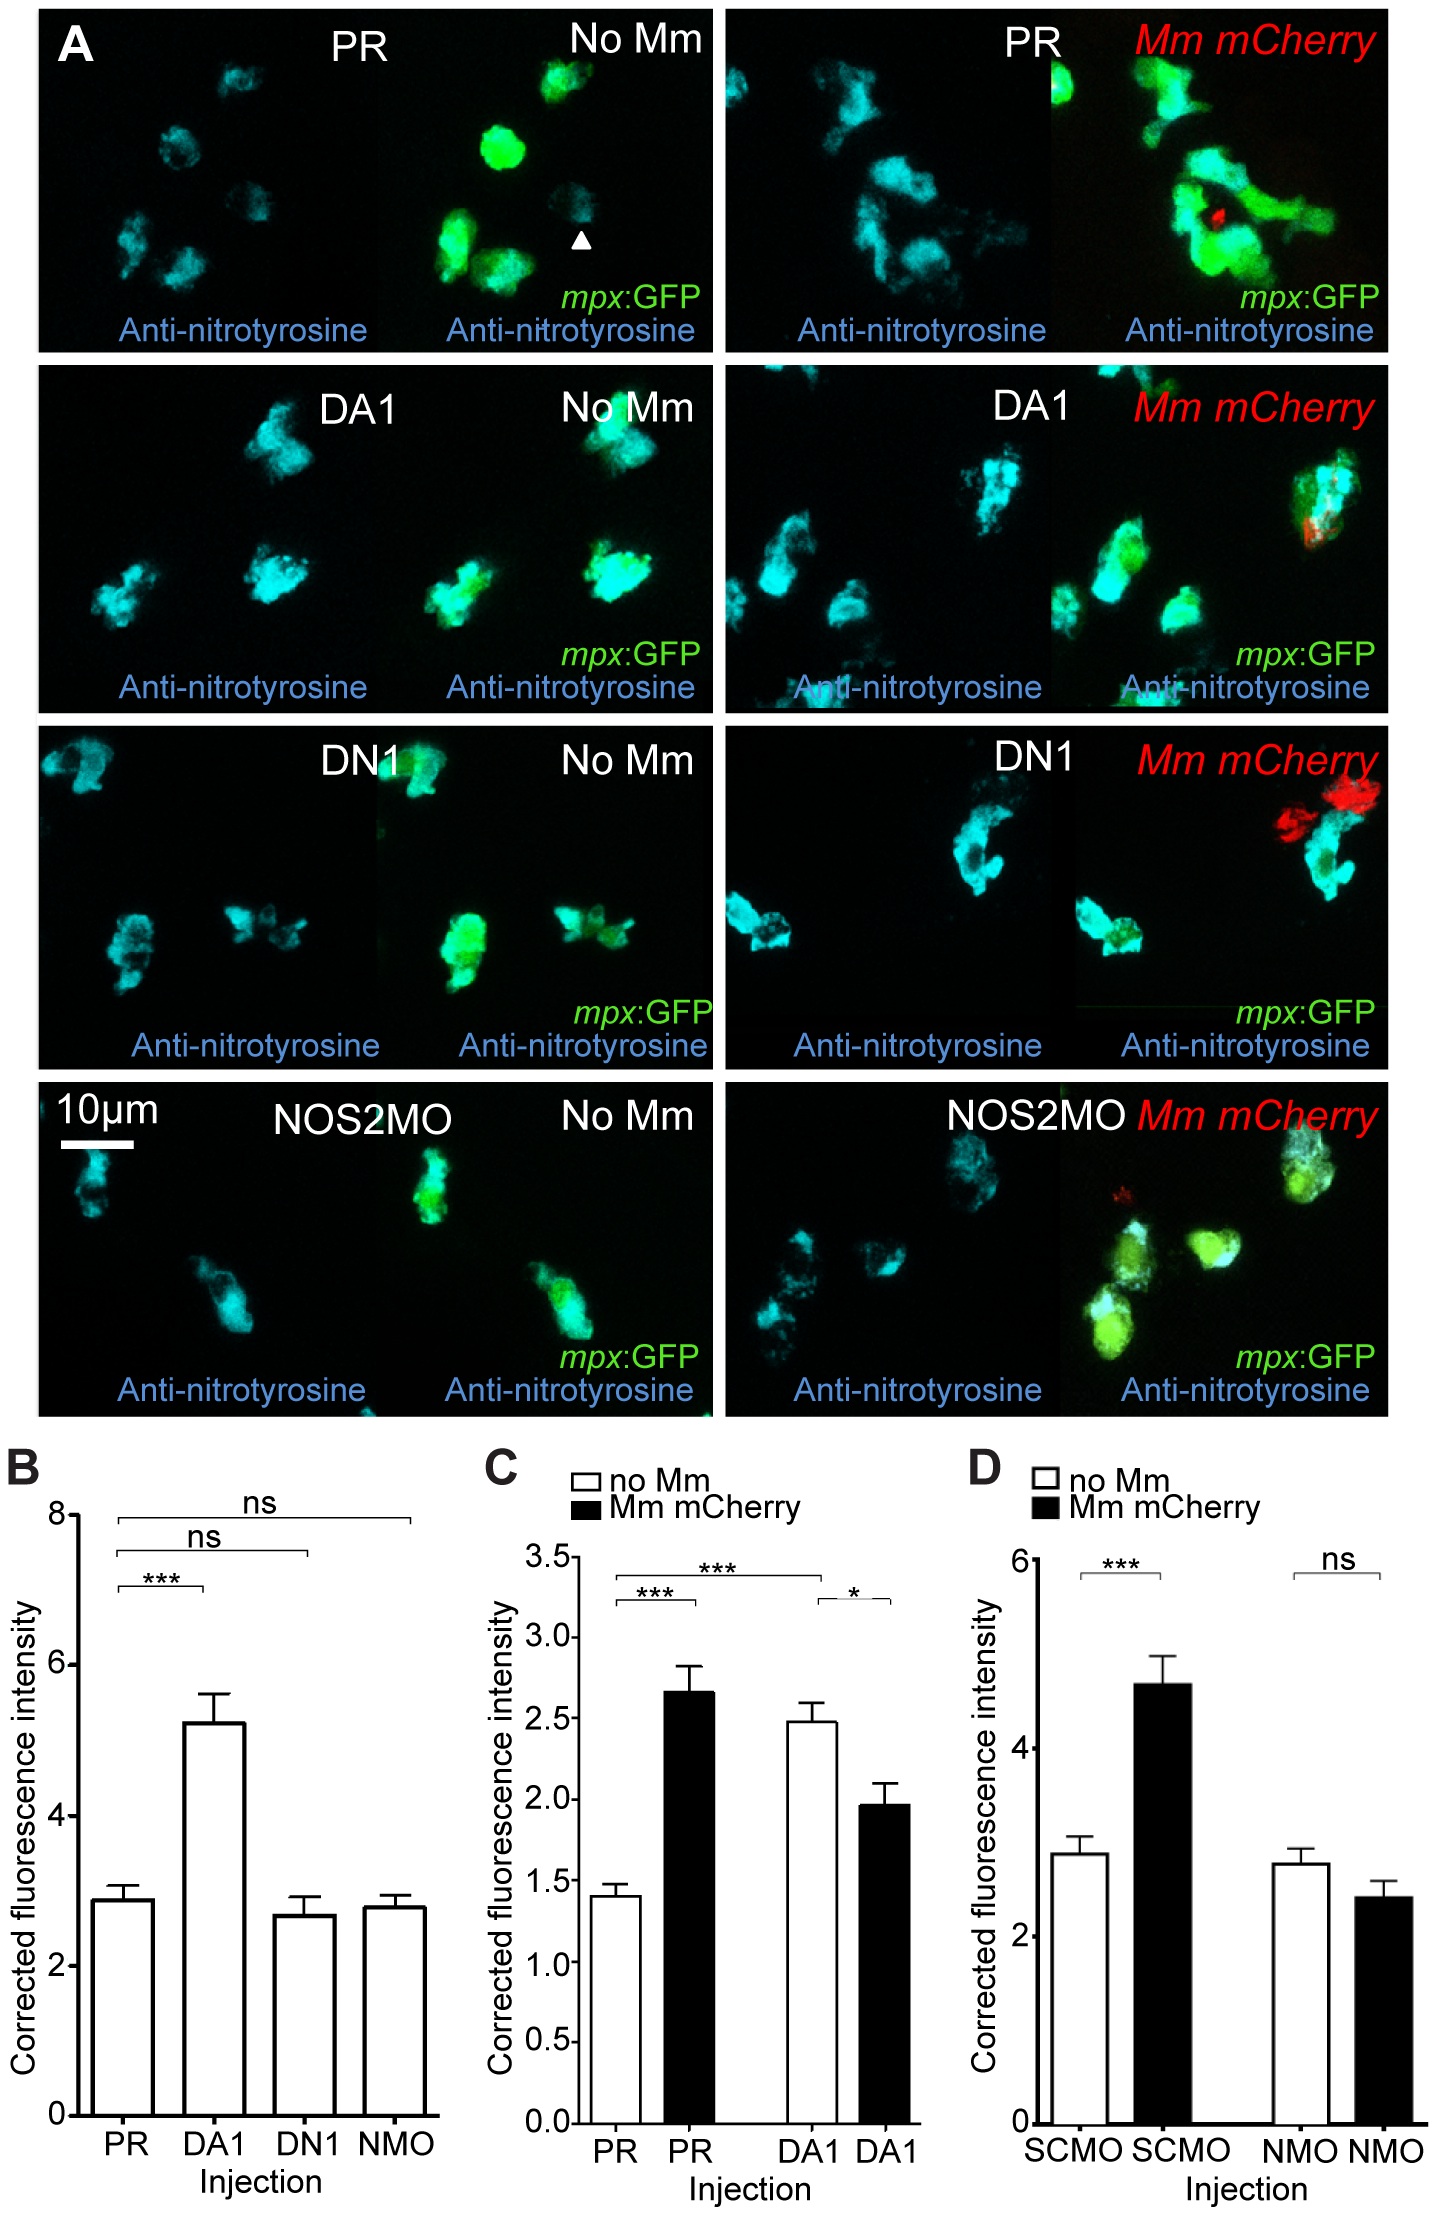
Fig. 3
Nitrosylation levels are increased in unchallenged leukocytes with stabilized Hif-1α.
(A) Example fluorescence confocal z-stacks of the caudal vein region of embryos stained with Alexa-633 labeled anti-nitrotyrosine antibody (blue), imaged at 1 dpi in the presence or absence of Mm infection. Embryos were injected with phenol red (PR), dominant active hif-1αb (DA1), dominant negative hif-1αb (DN1), or nos2a morpholino (NOS2MO). Anti-nitrotyrosine mainly co-localized with neutrophils (labeled with mpx:GFP), however, some cells without GFP (white arrowhead), possibly macrophages, were also labeled. (B) Corrected fluorescence intensity levels of anti-nitrotyrosine antibody confocal z-stacks in uninfected larvae at 2 dpf (1 dpi equivalent). Dominant active hif-1αb (DA1) had significantly increased anti-nitrotyrosine levels in the absence of Mm bacterial challenge compared to phenol red (PR) injected controls. Data shown are mean ± SEM, n = 67–92 cells accumulated from 5 embryos per group. Graph shown is a representative dataset of 3 independent experiments. (C) Corrected fluorescence intensity levels of anti-nitrotyrosine antibody confocal z-stacks of dominant active hif-1αb (DA1), or phenol red (PR) control injected embryos in the presence or absence of Mm infection at 1 dpi. Data shown are mean ± SEM, n = 233–270 cells accumulated from 15 embryos. Graph shown is combined data from 3×5 embryos from independent experiments. (D) Corrected fluorescence intensity levels of anti-nitrotyrosine antibody confocal z-stacks of nos2a morpholino (NMO) or standard control morpholino (SCMO) injected embryos imaged at 1 dpi (2 dpf) in the presence or absence of Mm. Data shown are mean ± SEM, n = 46–92 cells accumulated from 5 embryos. Graph shown is a representative dataset of 3 independent experiments.