
|
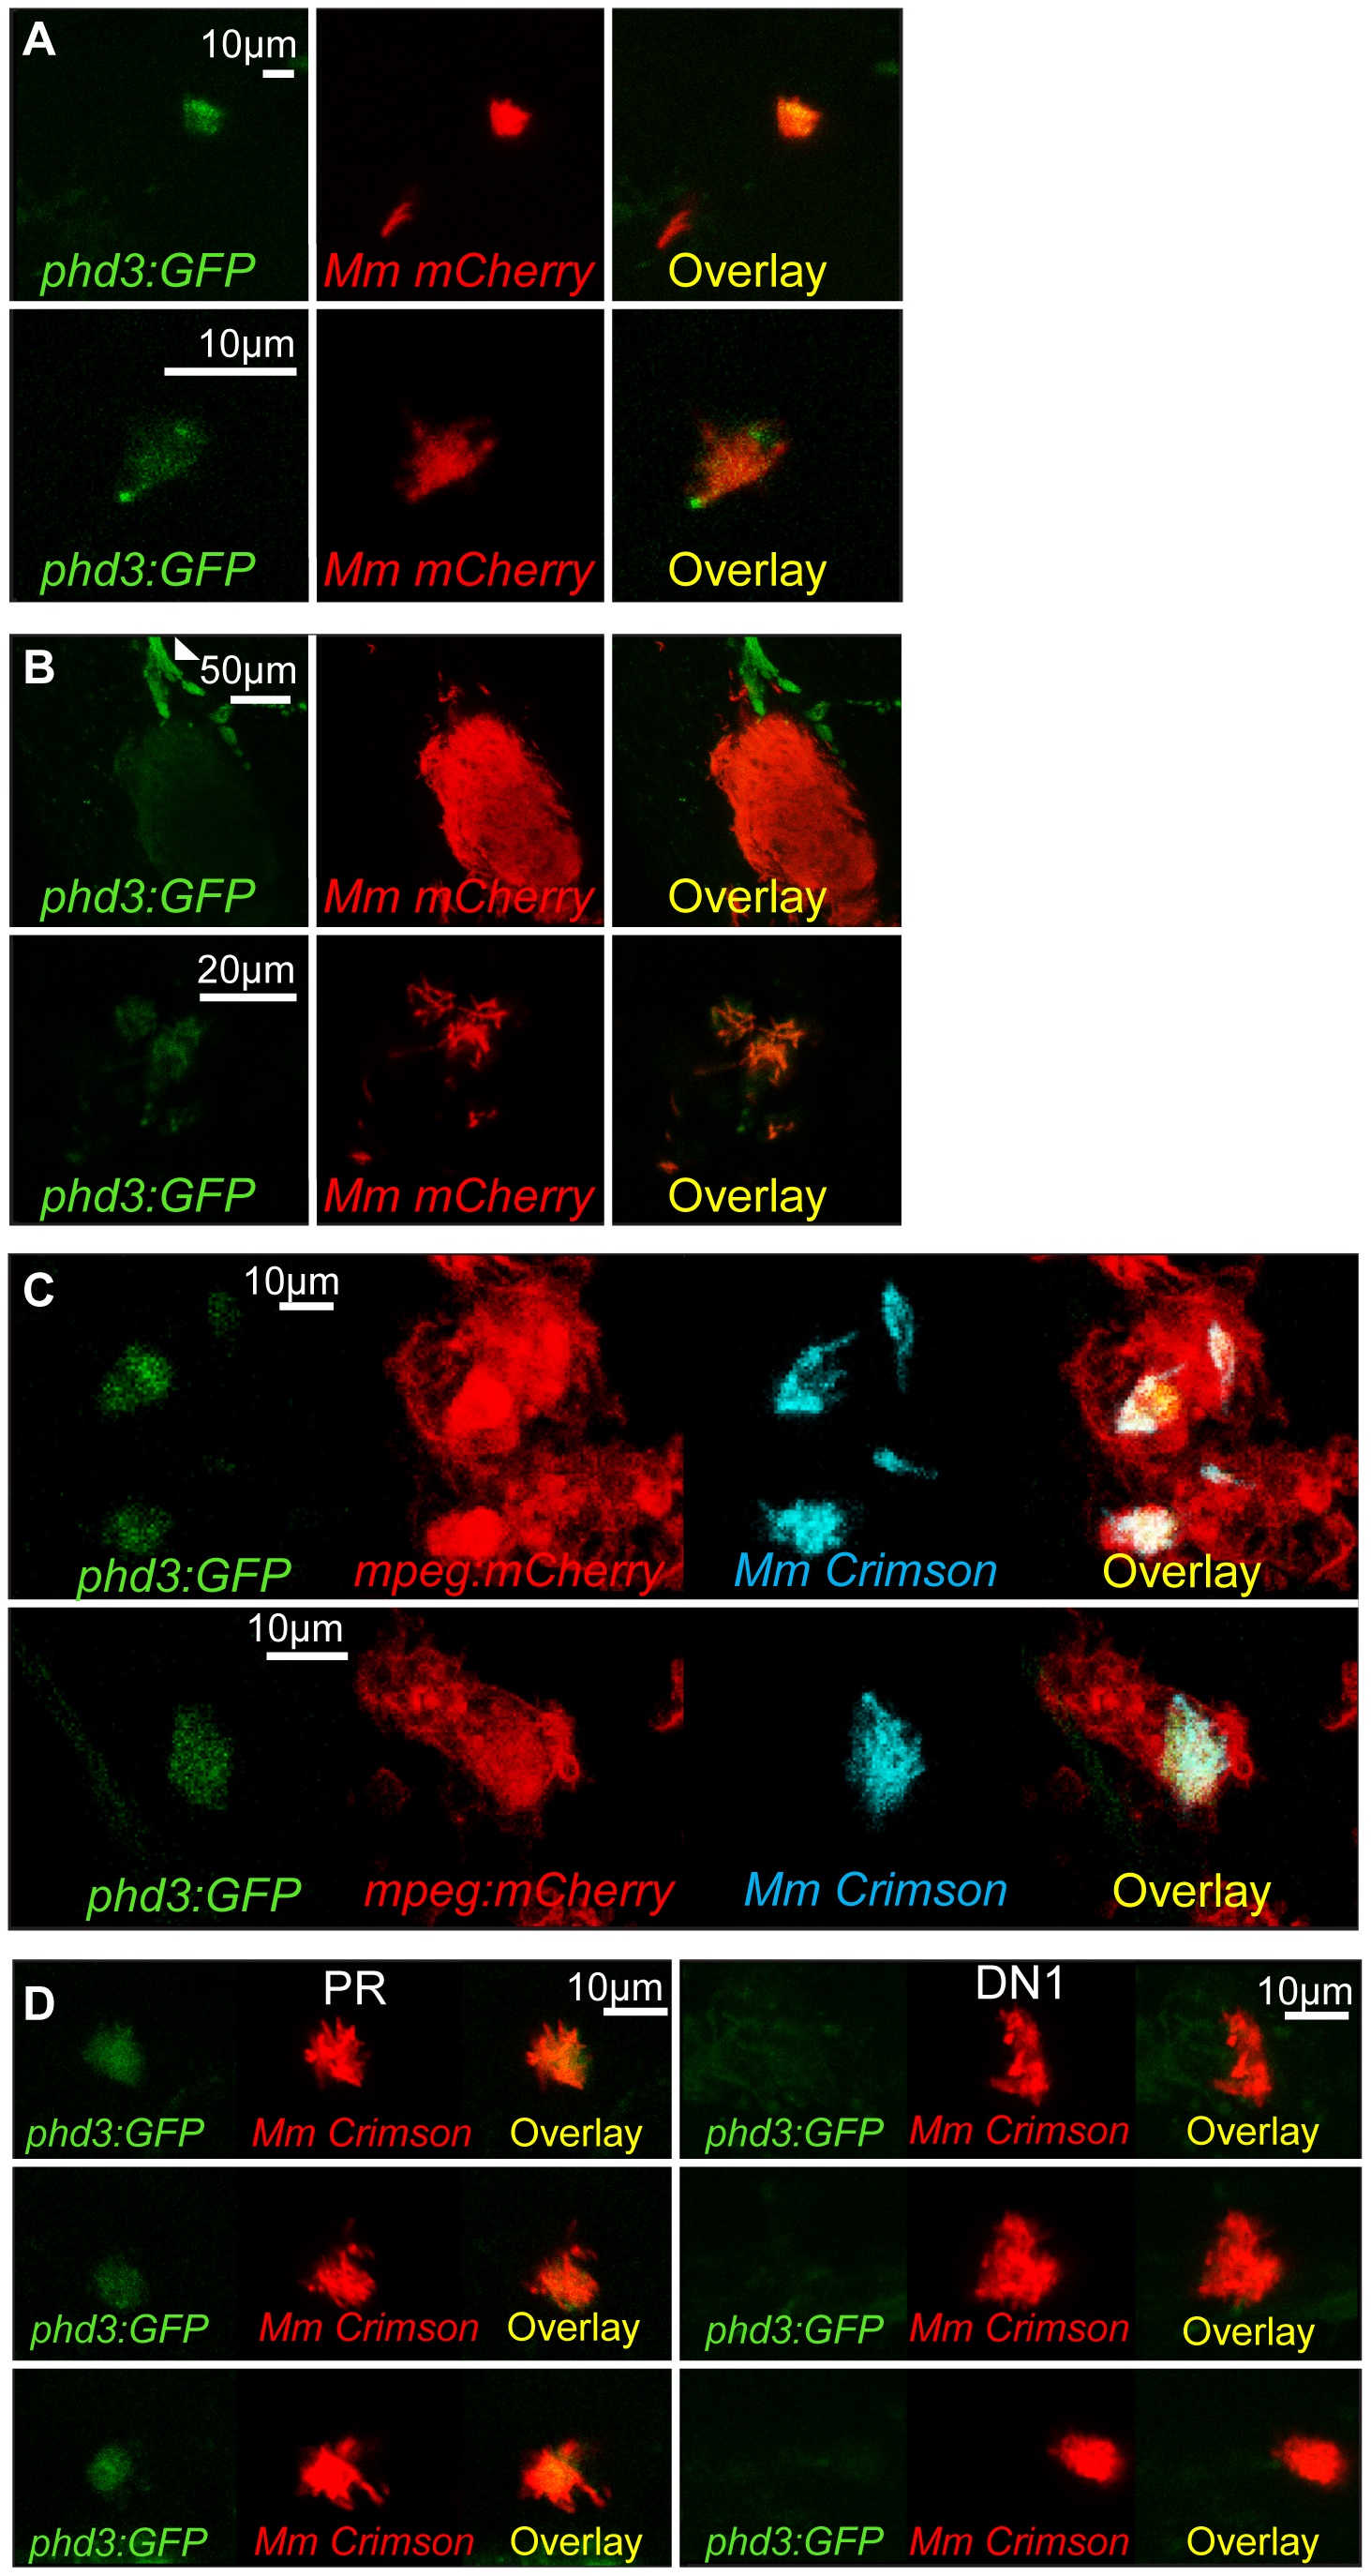
Fig. 1 phd3 is expressed in infected macrophages during early stage Mm pathogenesis in a Hif-1α dependent manner.
(A) Fluorescent confocal micrographs of 2 examples of infected areas prior to granuloma formation of 1 dpi embryos (upper and lower panels). phd3 expression was detected by GFP levels, in green, using the Tg(phd3:GFP)i144 transgenic line. Mm mCherry is shown in the red channel. Increased levels of phd3:GFP expression were detectable in cells associated with infection. (B) Fluorescent confocal micrographs of 2 granulomas at 6 dpi (upper and lower panels). Only low levels of phd3:GFP expression were detectable in areas of infection. The low level of GFP is illustrated in the upper panel where the auto-fluorescence of a pigment cell (white arrowhead) is brighter than the phd3:GFP expression. (C) Fluorescent confocal micrographs of 2 embryos with Mm infected macrophages at 1 dpi. The phd3:GFP line was outcrossed to the mpeg1:mCherry line to show co-localization with infected macrophages. (D) phd3:GFP embryos were injected at the 1 cell stage with dominant negative hif-1αb RNA (DN1) or phenol red (PR) as a negative control. 60 embryos of each were screened for phd3:GFP expression using confocal microscopy and the 3 brightest areas of phd3:GFP expression were imaged and showed co-localization with Mm infection. In the DN1 group GFP laser levels and confocal settings were increased until background green fluorescence was visible showing no specific co-localisation with Mm.