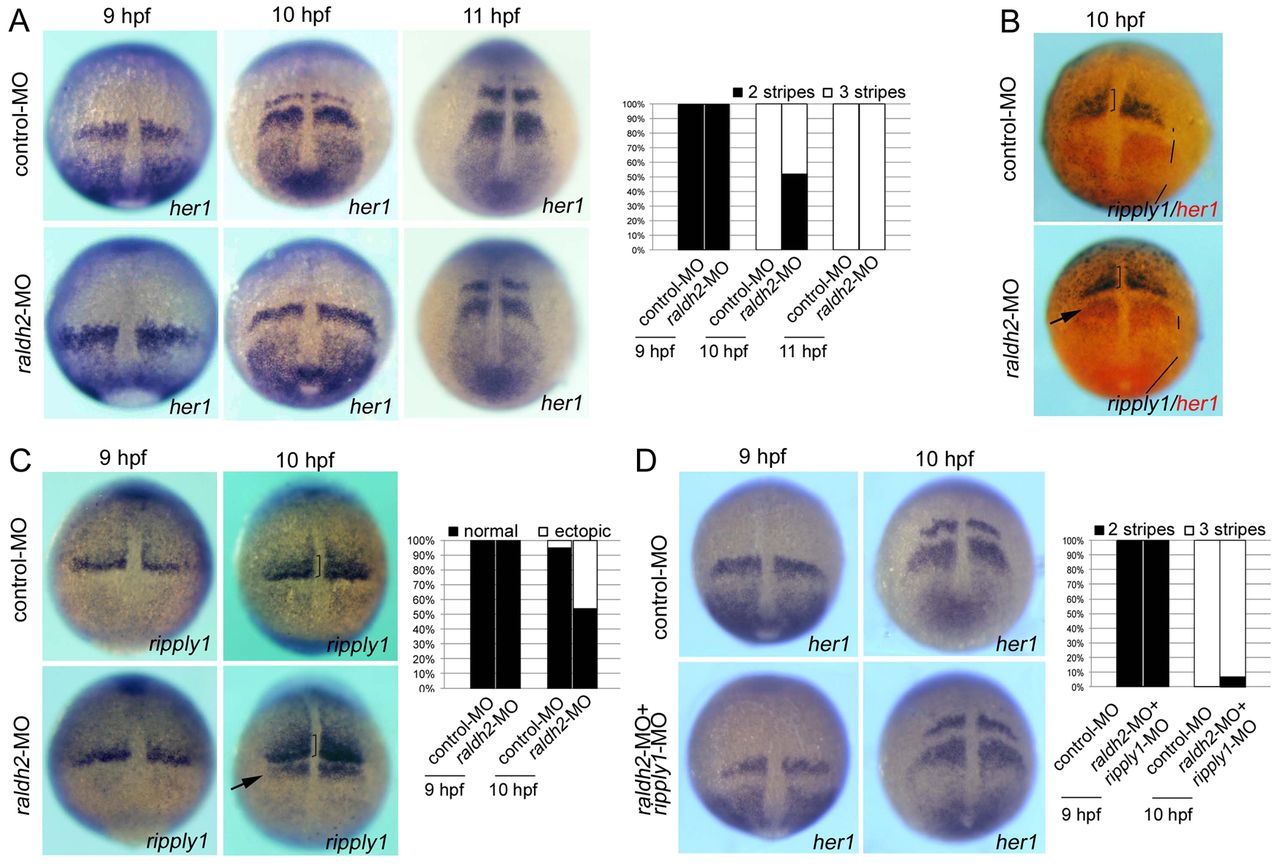
Fig. 4 Relationship between her1 and ripply1 expression during gastrulation. (A) Representative images of her1 expression in control MO- (upper panel; n=33, 37 and 26) and raldh2 MO-injected embryos at 9, 10 and 11 hpf (lower panel; n=35, 29 and 21). Dorsal view, anterior to the top. The increase in stripe number for her1 expression in control embryos is delayed in raldh2 morphants (right graph). A statistically significant difference could be seen between embryos injected with control MO and raldh2 MO (P<0.05, P=0.29×10⁻⁶). (B) Double staining of her1 (red) and ripply1 (purple) in control MO- (upper panel) and raldh2 MO-injected (lower panel) embryos at 10 hpf. (C) Representative images of ripply1 expression in control MO- (upper panel) and raldh2 MO-injected (lower panel) embryos at 9 and 10 hpf. Ectopic expression of ripply1 could be observed in raldh2 morphants at 10 hpf (arrow) (P<0.05, P=0.50×10⁻⁷; right graph). (D) Representative images of her1 expression in control MO- (upper panel; n=58 and 52) and raldh2 MO + ripply1 MO-injected (lower panel; n=63, and 59) embryos at 9, 10 and 11 hpf. Dorsal view, anterior to the top. Decreased number of the her1 stripe in raldh2 morphants could be restored by co-injection of ripply1 MO (right graph). A statistically significant difference was observed in embryos (10 hpf) injected with raldh2 MO versus embryos (10 hpf) injected with raldh2 MO + ripply1 MO (P<0.05, P=0.42×10⁻⁵), but not in embryos (10 hpf) injected with control MO versus embryos (10 hpf) injected with raldh2- MO + ripply1 MO (P>0.05, P=0.12).
Image
Figure Caption
Figure Data
Acknowledgments
This image is the copyrighted work of the attributed author or publisher, and
ZFIN has permission only to display this image to its users.
Additional permissions should be obtained from the applicable author or publisher of the image.
Full text @ Development

