
|
Fig. 5
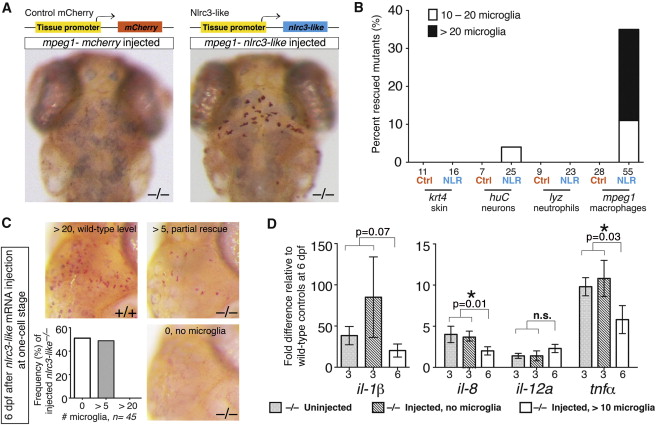
nlrc3-like Has an Autonomous and Continuous Function in Macrophages that Become Microglia
(A) Top view is a diagram of transgenic constructs driving either control mCherry or nlrc3-like expression by tissue-specific gene promoters in skin (keratin 4/krt4), neurons (elavl3/huC), neutrophils (lyz), or macrophages (mpeg1). Bottom view is representative images showing rescue of neutral red-positive microglia in nlrc3-like/ mutants when expression of wild-type nlrc3-like is restored in macrophages (right), but not by control mCherry expression (left).
(B) Plot quantifies the percentage of microglia rescue using different tissue-specific expression vectors. Ctrl, control mCherry injected; NLR, nlrc3-like construct injected.
(C) Images and plot show microglia by neutral red staining at 6 dpf, after nlrc3-like mRNA injection at the one-cell stage. Injected nlrc3-like/ mutants show no microglia or partial rescue (more than five microglia) at 6 dpf, but no mutants are rescued to the wild-type level. In contrast, RNA injection does fully rescue microglia in some mutants at earlier stages ( Figure S1).
(D) Graph shows relative proinflammatory transcript levels after transient rescue of nlrc3-like/ mutants by injection of wild-type nlrc3-like mRNA at one-cell stage. Injected mutants with no microglia at 6 dpf have elevated levels of proinflammatory cytokine transcripts that are similar to uninjected mutants. In contrast, mutants with partial rescue of microglia at 6 dpf have lower levels of il-8 and tnf-α expression, indicating that the number of microglia correlates inversely to the extent of inflammatory cytokine expression. Individual plots are normalized to their corresponding wild-type siblings, either uninjected or injected.
Numbers below bar graphs represent n, number of embryos analyzed. Error bars show SEM. p < 0.05, one-tailed Student?s t test. n.s., not significant.
See also Figures S4 and S5.