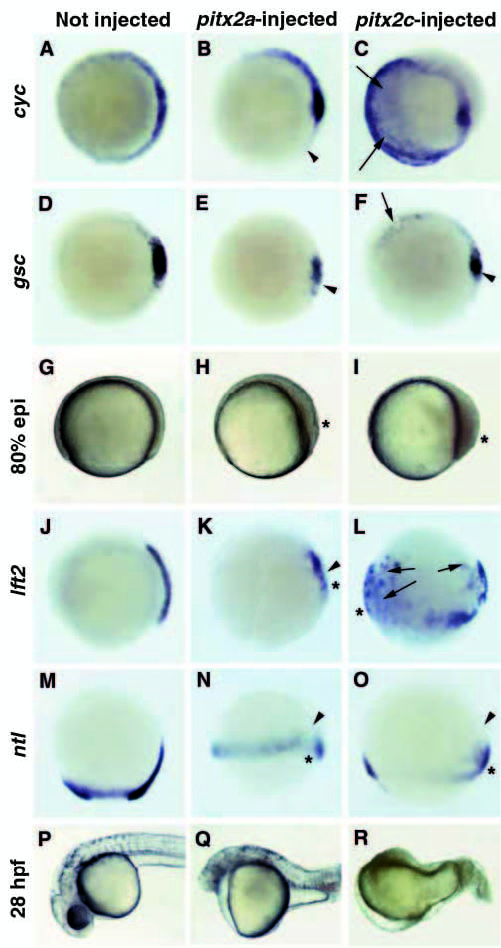
Fig. 4 Ectopic expression of pitx2a and pitx2c disrupts mesendoderm formation. Embryos were injected at the 1-2 cell stage with RNA. (A,D,G,J,M,P) Control or uninjected embryos. (B,E,H,K,N,Q) pitx2a-injected embryos. (C,F,I,L,O,R) pitx2c injected embryos. (A-C) Expression of cyc at 40% epiboly; animal pole views with dorsal to the right. (B) pitx2a-injected embryo with arrowhead marking reduced expression of cyc in the margin. (C) pitx2c-injected embryo with arrows marking regions of increased cyc expression. (D-F) gsc expression at 40% epiboly; animal pole views with dorsal to the right. (E) A reduced number of cells with gsc expression in a pitx2a-injected embryo (arrowhead). (F) pitx2c injected embryo with less gsc positive cells on the dorsal side (arrowhead) and ectopic activation of gsc expression in other marginal cells (arrow). (G-I) Lateral view of embryos at 80% epiboly. (G) Control embryo with dorsal to the right. (H,I) pitx2aand pitx2c-injected embryos displaying slowed epiboly and excess cells at the blastoderm margin (asterisks). (J-L) Expression of lft2 at 80% epiboly. (K,L) Asterisks mark an increased number of cells at the margin, arrowhead shows reduced expression, and arrows designate regions of ectopic expression of lft2. (M-O) Expression of ntl/brachyury at 80-90% epiboly. (M) Control embryo with dorsal to the right. (N,O) pitx2a- and pitx2c-injected embryos displaying slowed epiboly and a lack of dorsal accumulation of ntl (arrowheads). Asterisks mark an increased number of cells at the margin. (P-R) Lateral view of 28 hpf embryos with anterior to left.
Image
Figure Caption
Acknowledgments
This image is the copyrighted work of the attributed author or publisher, and
ZFIN has permission only to display this image to its users.
Additional permissions should be obtained from the applicable author or publisher of the image.
Full text @ Development

