Image
Figure Caption
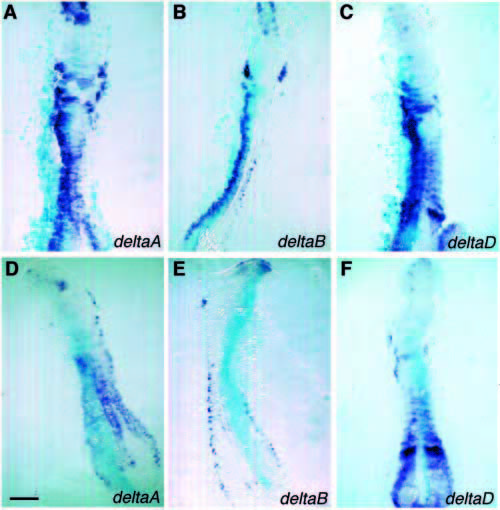
Fig. 8 Effects on expression of delta genes in the neural plate following injection of X-Delta1 or X-Delta1dn RNA, together with lacZ RNA as a marker, into one blastomere. Flat mounts at 5- to 6- somite stage, with expression of deltaA, deltaB and deltaD in purpleblue, lacZ marker in sky-blue. Where X-Delta1 RNA is present, expression of all three delta genes is inhibited; where X-Delta1dn RNA is present, they are all overexpressed. Note in A-C that dramatic effects of X-Delta1dn are seen even in regions where there is normally only low-level expression of endogenous delta genes. Scale bar, 200 μm.
Acknowledgments
This image is the copyrighted work of the attributed author or publisher, and
ZFIN has permission only to display this image to its users.
Additional permissions should be obtained from the applicable author or publisher of the image.
Full text @ Development

