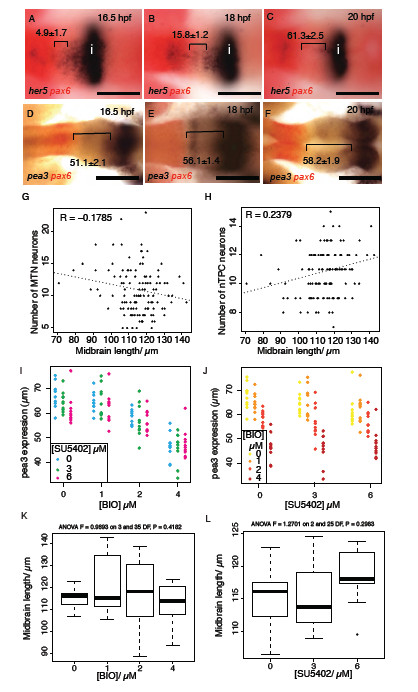
Fig. S3
FGF-responsive genes show a posterior shift during midbrain development and FGF and Wnt signalling interact to regulate pea3 expression during midbrain development. Dorsal views of embryos processed by in situ reveals her5 (A-C) and pea3 (D-F) expression relative to pax6 (forebrain); expression retracts posteriorly towards the isthmus over time (distance between midbrain expression boundary ? pax6 in μm, ± s.e.m., n=10). Plots of midbrain size relative to MTN number (G) and nTPC number (H) from animals treated with varying doses of SU5402 or BIO reveals no correlation (n=240). Plots of pea3 expression at 24 hpf after application of varying SU5402 (I) or BIO (J) doses (on x-axis) reveal that BIO application results in a strong downregulation of pea3 independently from the reduction of expression caused by SU5402 (dots represent individual samples, n=120). Plots of midbrain length in 24 hpf embryos treated with BIO (0, 1, 2, 4μM) or SU5402 (0, 3, 6μM) from 14 hpf (K,L). ANOVA tests for significance did not show any linkage between BIO (p=0.42) or SU5402 (p=0.30) concentration and midbrain length. Isthmus (i). Scale bars 100μm (A-F).

