Fig. S4
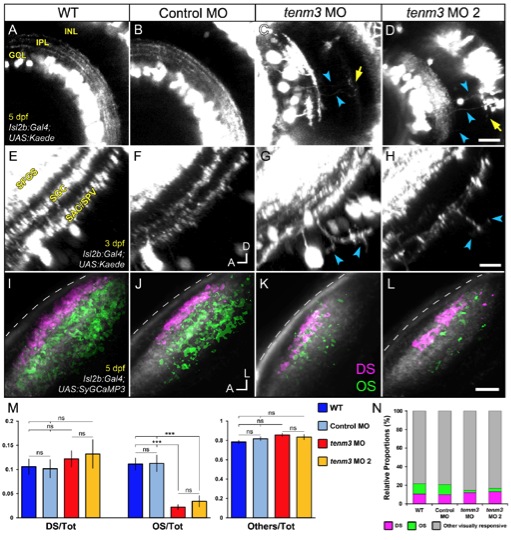
Two Different Morpholino Oligonucleotides Against teneurin-3 Produce Equivalent Structural and Functional Results, Related to Figure 2, 4, 5 and S1
(A-D) Kaede-expressing RGCs in the retina of 5 dpf WT, control MO-, tenm3 MO-, and tenm3 MO 2-injected Tg(Isl2b:Gal4;UAS:Kaede) zebrafish larvae. Aberrant RGC neurite extensions in the inner nuclear layer (INL) are detected in tenm3 MO-injected larvae (C) as well as in tenm3 MO 2- injected larvae (D, cyan arrowheads) but not in WT (A) and Control MO-injected (B) larvae. In some cases these processes reach the outer plexiform layer both in tenm3 MO- (C) and tenm3 MO 2- injected larvae (D, yellow arrows) but not in control larvae. All images represent maximum intensity projections of ~20 μm confocal Z stacks. Scale bar = 20 μm. GCL, ganglion cell layer; IPL, inner plexiform layer. WT, control MO and tenm3 MO images in Figure 2 are reported here for comparison. (E-H) RGC axon lamination in deep laminae of the tectal neuropil of 3 dpf Tg(Isl2b:Gal4;UAS:Kaede) zebrafish larvae. Aberrant extensions projecting into the stratum periventriculare (SPV) are detected in tenm3 MO-injected larvae (G) as well as in tenm3 MO 2- injected larvae (H, cyan arrowheads) but not in control larvae (E and F). All images represent maximum intensity projections of ~50 μm confocal Z stacks that have been rotated around the longitudinal axis to best show axonal lamination. Scale bar = 10 μm. A, anterior; D, dorsal. SFGS, stratum fibrosum et griseum superficiale; SAC, stratum album centrale. WT, control MO and tenm3 MO images in Figure 4 are reported here for comparison. (I-L) Composite parametric maps across multiple 5 dpf Tg(Isl2b:Gal4;UAS:SyGCaMP3) larvae representing the spatial distribution of direction-selective (DS, magenta) and orientation-selective (OS, green) voxels within each group (WT n = 8 larvae; control MO n = 11; tenm3 MO n = 20; tenm3 MO 2 n = 8). Note that both in tenm3 MO- (K) and tenm3 MO 2-injected larvae (L) the overall number of OS voxels is decreased compared to control larvae (I and J). Within individual parametric maps, voxel brightness is proportional to the summed incidence of each functional response across all larvae imaged. The standard space template image derived for each group (greyscale) provides an anatomical reference. Dashed lines indicate the skin overlaying the tectum. Scale bar = 20 μm. A, anterior; L, lateral. WT, control MO and tenm3 MO images in Figure 5 are reported here for comparison. (M) Ratios between defined voxel classes and total visually responsive voxels within each group. Both in tenm3 MO- and tenm3 MO 2-injected larvae there is a significant change in the ratio between OS voxels and the total population of visually responsive voxels (OS/tot tenm3 MO 0.022 ± 0.004, n = 20 larvae; tenm3 MO 2 0.034 ± 0.011, n = 8; WT 0.111 ± 0.012, n = 8; control MO 0.112 ± 0.016, n = 11; F(3,44) = 18.88, p < 0.0001). No significant change was observed in the relative proportions of the other voxel populations (DS/tot WT 0.105 ± 0.015, control MO 0.101 ± 0.018, tenm3 MO 0.121 ± 0.016, tenm3 MO 2 0.132 ± 0.029, F(3,44) = 0.37, p = 0.775; Others/tot WT 0.783 ± 0.016, control MO 0.817 ± 0.019, tenm3 MO 0.856 ± 0.016, tenm3 MO 2 0.833 ± 0.025, F(3,44) = 1.999, p = 0.128, n = 47 larvae). Non-DS and non-OS voxels are classified as ?others?. All graphs show mean values ± SEM. ***p < 0.001; ns, not significant by one-way ANOVA followed by Tukey?s HSD test. (N) Bar graph showing the proportions of DS and OS voxel classes relative to visually responsive voxels within each group. Note that the OS input becomes the smallest population of RGCs responding to drifting bars both in tenm3 MO- and tenm3 MO 2-injected larvae.
Image
Figure Caption
Acknowledgments
This image is the copyrighted work of the attributed author or publisher, and
ZFIN has permission only to display this image to its users.
Additional permissions should be obtained from the applicable author or publisher of the image.
Full text @ Cell Rep.

