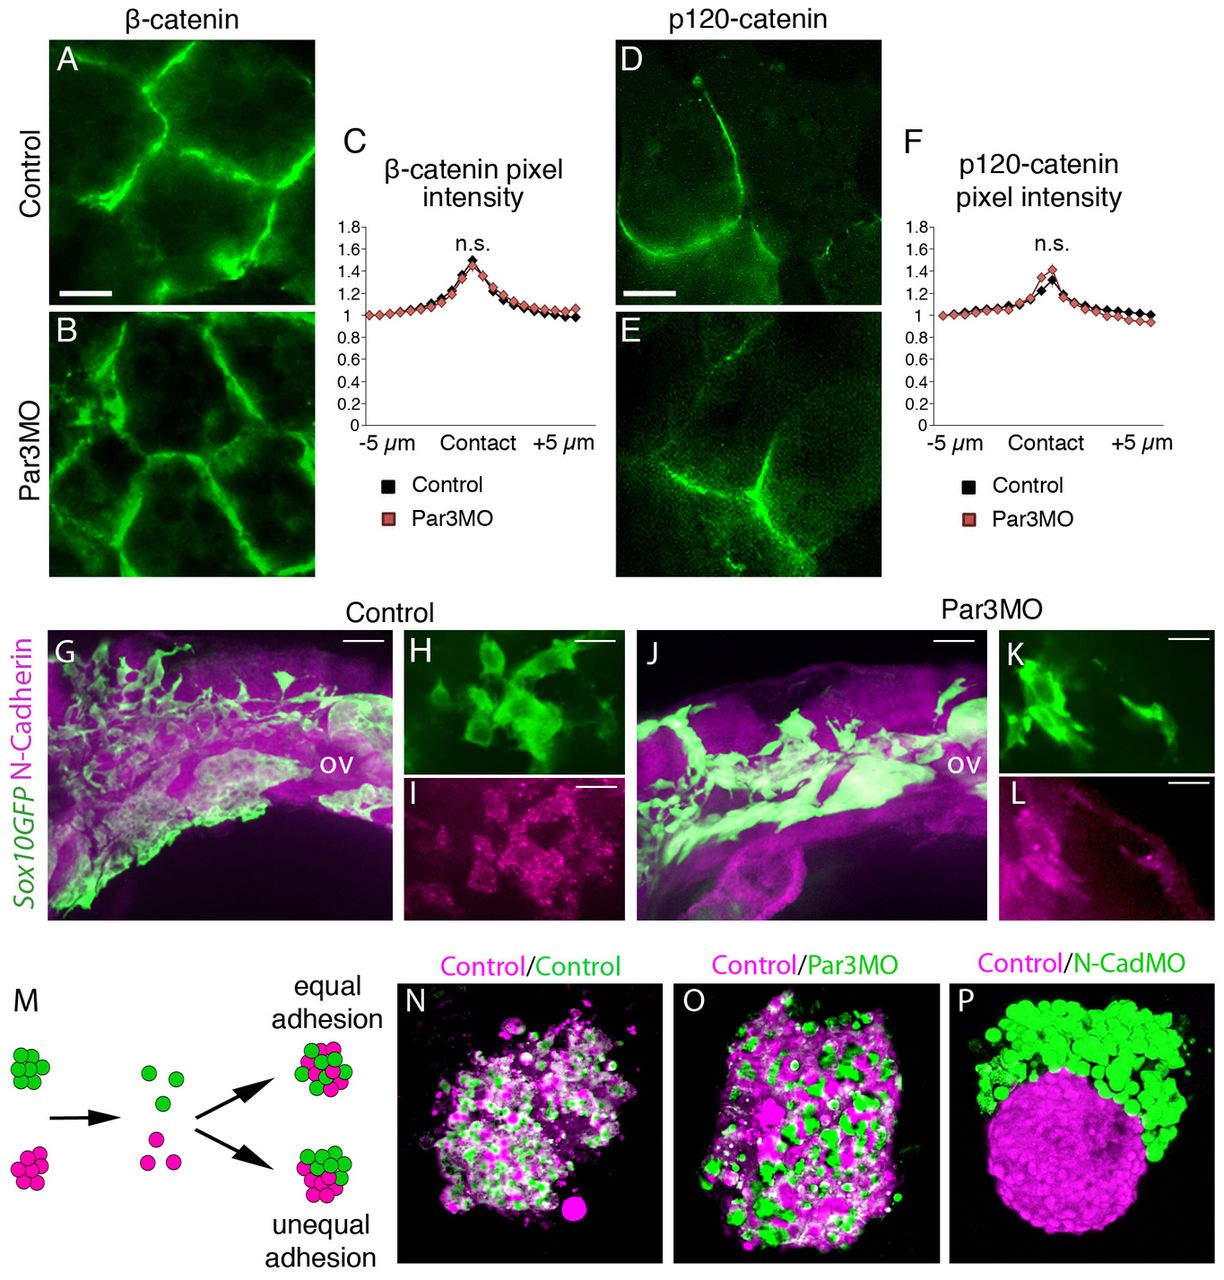
Fig. 3
Par3 inhibition does not affect cell adhesion in Xenopus or zebrafish. (A-F) Cell adhesion molecules analysed in Xenopus embryos. (A-C) Immunostaining against β-catenin in control (A) or Par3MO-injected NC cells (B). (C) Pixel intensity of β-catenin immunostaining was measured across the contact and normalised to the average value background levels 5 μm away from the contact for each image. There is no difference in pixel intensity between control cells (n=84 contacts) and Par3MO-injected cells (n=44 contacts; P>0.05 at all distances from contact). (D-F) Control (D) or Par3MO-injected (E) NC cells expressing p120-cateninGFP. (F) Pixel intensity analysis as described in C. There is no difference in pixel intensity of p120-catenin immunostaining between control cells (n=24 contacts) and Par3MO-injected cells (n=41 contacts; P>0.05 at all distances from contact). (G-L) N-cadherin immunostaining in control (G-I) or Par3MO injected (J-L) zebrafish embryos. sox10GFP transgenic embryos were used to identify NC cells. Note that N-cadherin staining is not affected by Par3MO in the NC. n=150 embryos, fixed at 24 hpf. (M-P) Cell adhesion is not affected by Par3MO. (M) Schematic representation of the cell reaggregation assay. (N) Control Xenopus NC cells. (O) Control/Par3MO Xenopus NC cells. (P) Control/N-cadherinMO Xenopus NC cells. Scale bars: 10 μm.

