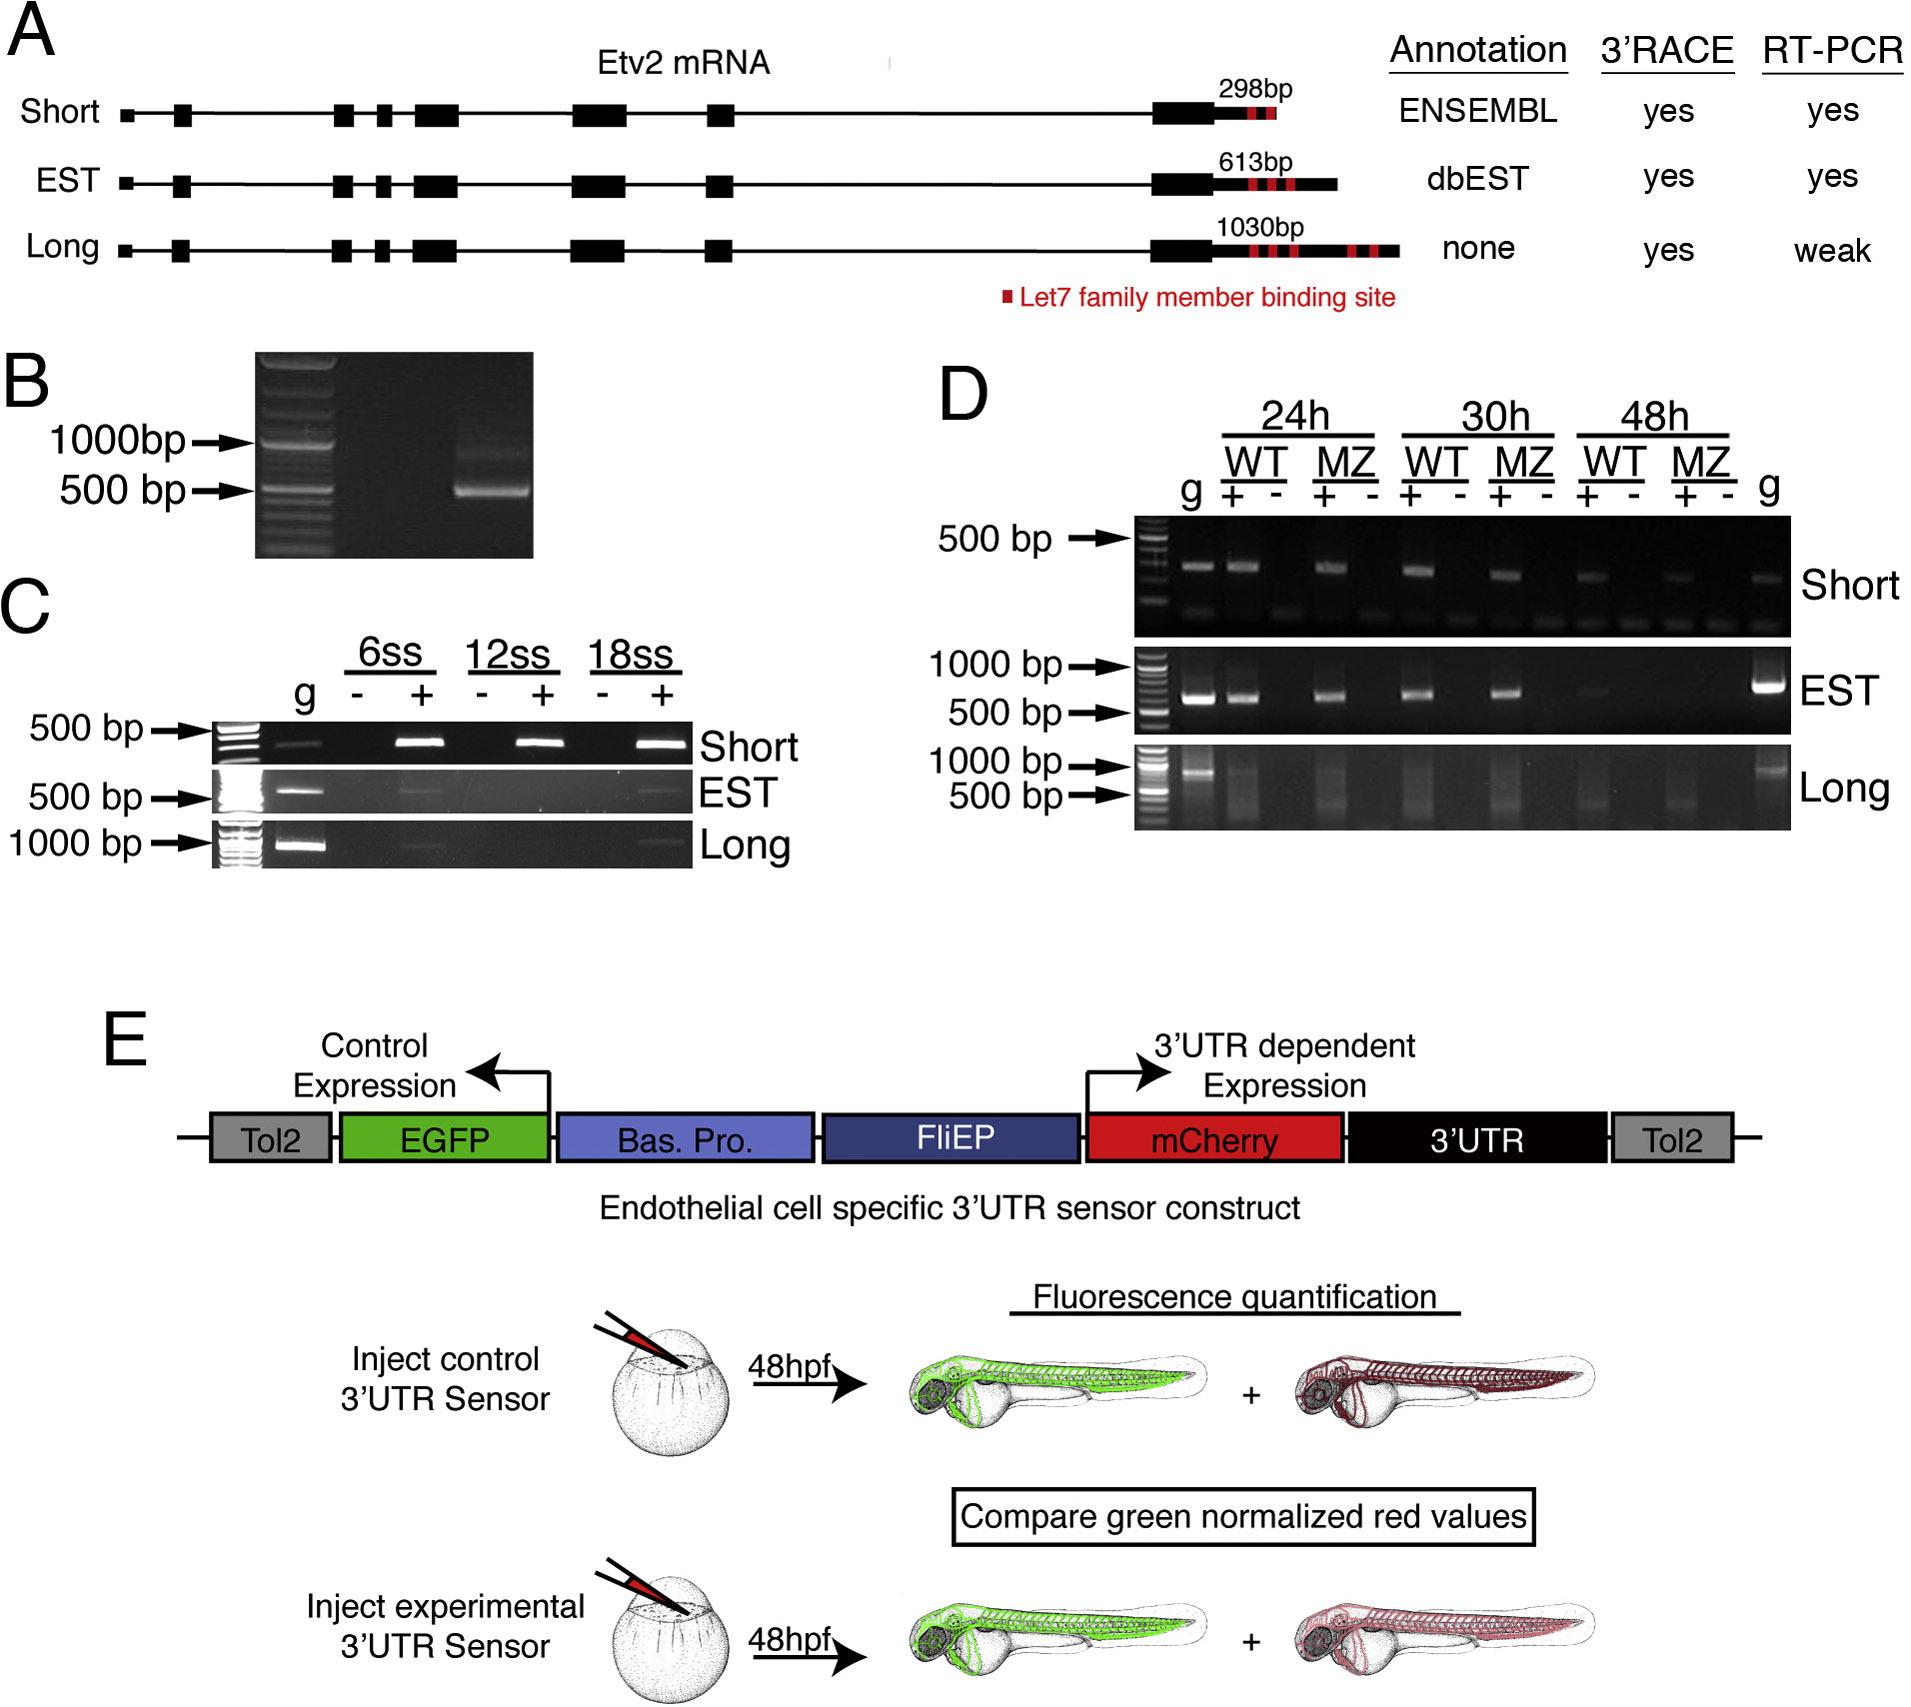
Fig. S2 Evidence for alternative 3′ UTRs encoded by the zebrafish etv2 locus. (A) Schematic depicting etv2 intron/exon structure and alternative 3′UTR lengths. Evidence for the existence of each isoform derived from annotation, 3′RACE, and RT-PCR is indicated. (B) 3′ RACE products amplified from 24 hpf embryos. (C, D) RT-PCR of etv2 UTRs from (C) wild type embryos at 6 to 18 ss and (D) wild type or MZDicer embryos at 24, 30, or 48 hpf. Genomic DNA (g) was used as a positive control. +denotes reverse transcribed cDNA template; indicates template without reverse transcription to rule out genomic DNA contamination. (E) Diagram of endothelial cell autonomous 3′ UTR sensor construct and experimental procedure for measuring post-transcriptional regulation of 3′ UTRs.
Reprinted from Developmental Biology, 384(1), Moore, J.C., Sheppard, S., Shestopalov, I.A., Chen, J.K., and Lawson, N., Post-transcriptional mechanisms contribute to Etv2 repression during vascular development, 128-40, Copyright (2013) with permission from Elsevier. Full text @ Dev. Biol.

