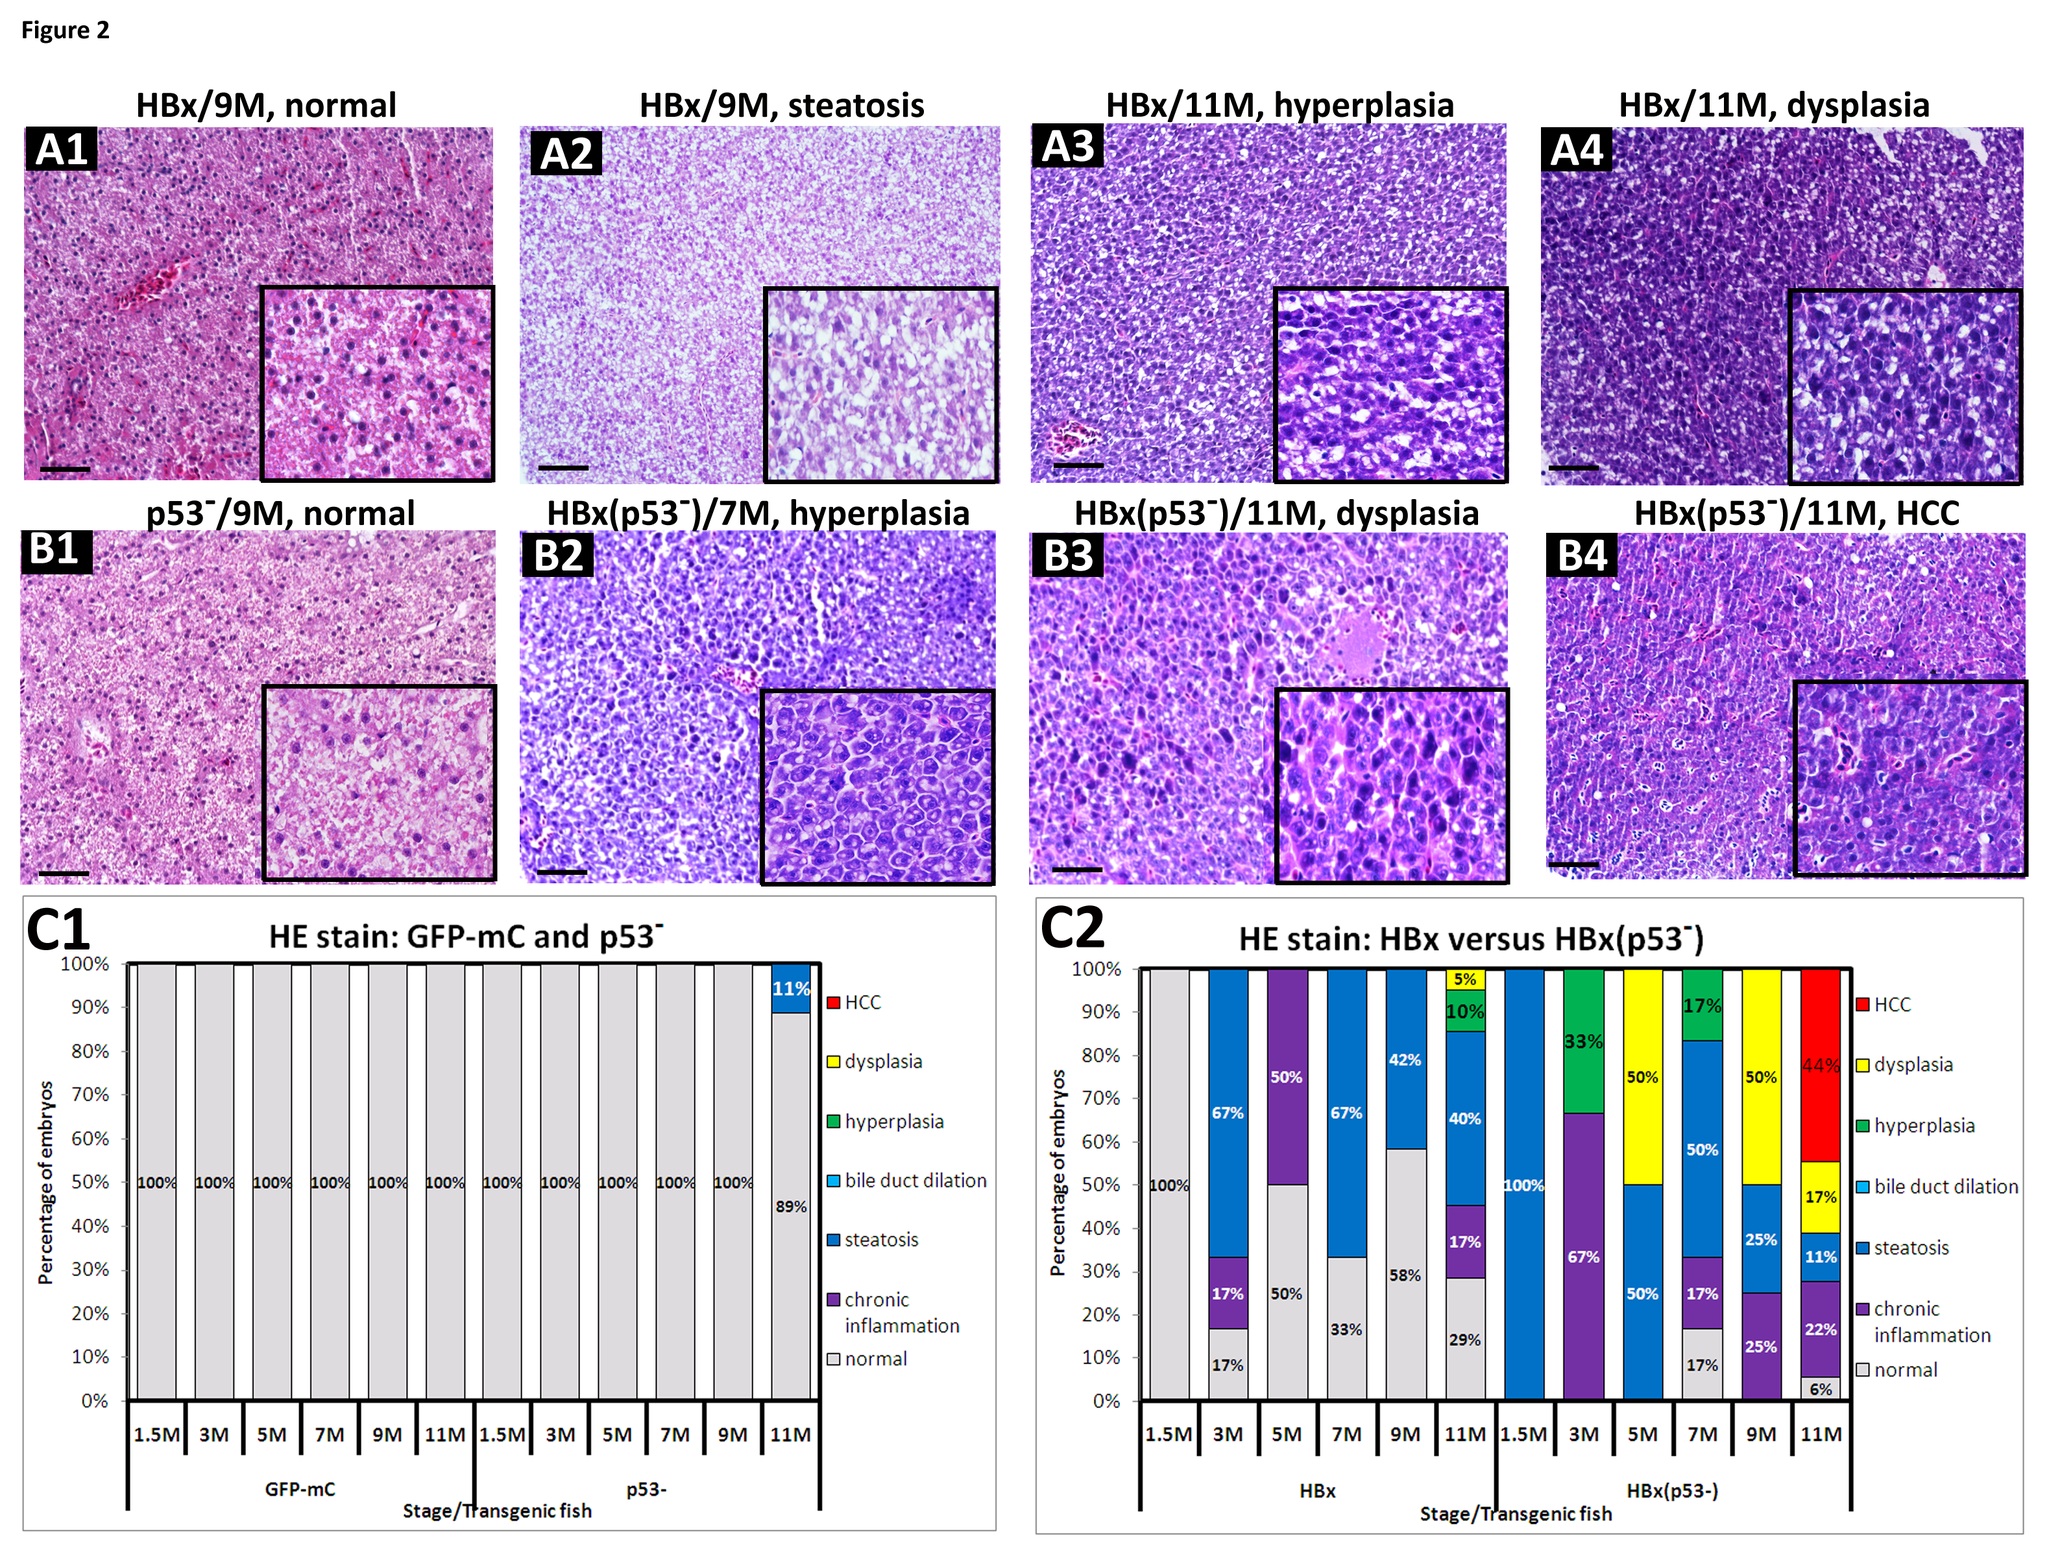
Fig. 2 (A1~A4) H&E staining of the liver sections from HBx transgenic fish revealed various pathological phenotypes, such as normal tissue, steatosis, hyperplasia and dysplasia. (B1) H&E staining of the liver sections from p53 mutant fish appeared normal. (B2~B4) H&E staining from the liver sections of HBx(p53-) transgenic fish revealed hyperplasia, dysplasia and HCC. All specimens are shown under 200-fold magnification. Scale bars: 50μm. The boxed areas are enlarged images with 400-fold magnification and are shown in the lower right corner. (C1) Statistical analysis of H&E staining results from GFP-mC and p53 mutant control fish. (C2) Statistical analysis of H&E staining results from HBx and HBx(p53-) transgenic fish. The different colors denote the different pathological features, as follows: gray-normal, purple-chronic inflammation, blue-steatosis, light blue-bile duct dilation, green-hyperplasia, yellow-dysplasia, and red-HCC, respectively.
Image
Figure Caption
Figure Data
Acknowledgments
This image is the copyrighted work of the attributed author or publisher, and
ZFIN has permission only to display this image to its users.
Additional permissions should be obtained from the applicable author or publisher of the image.
Full text @ PLoS One

