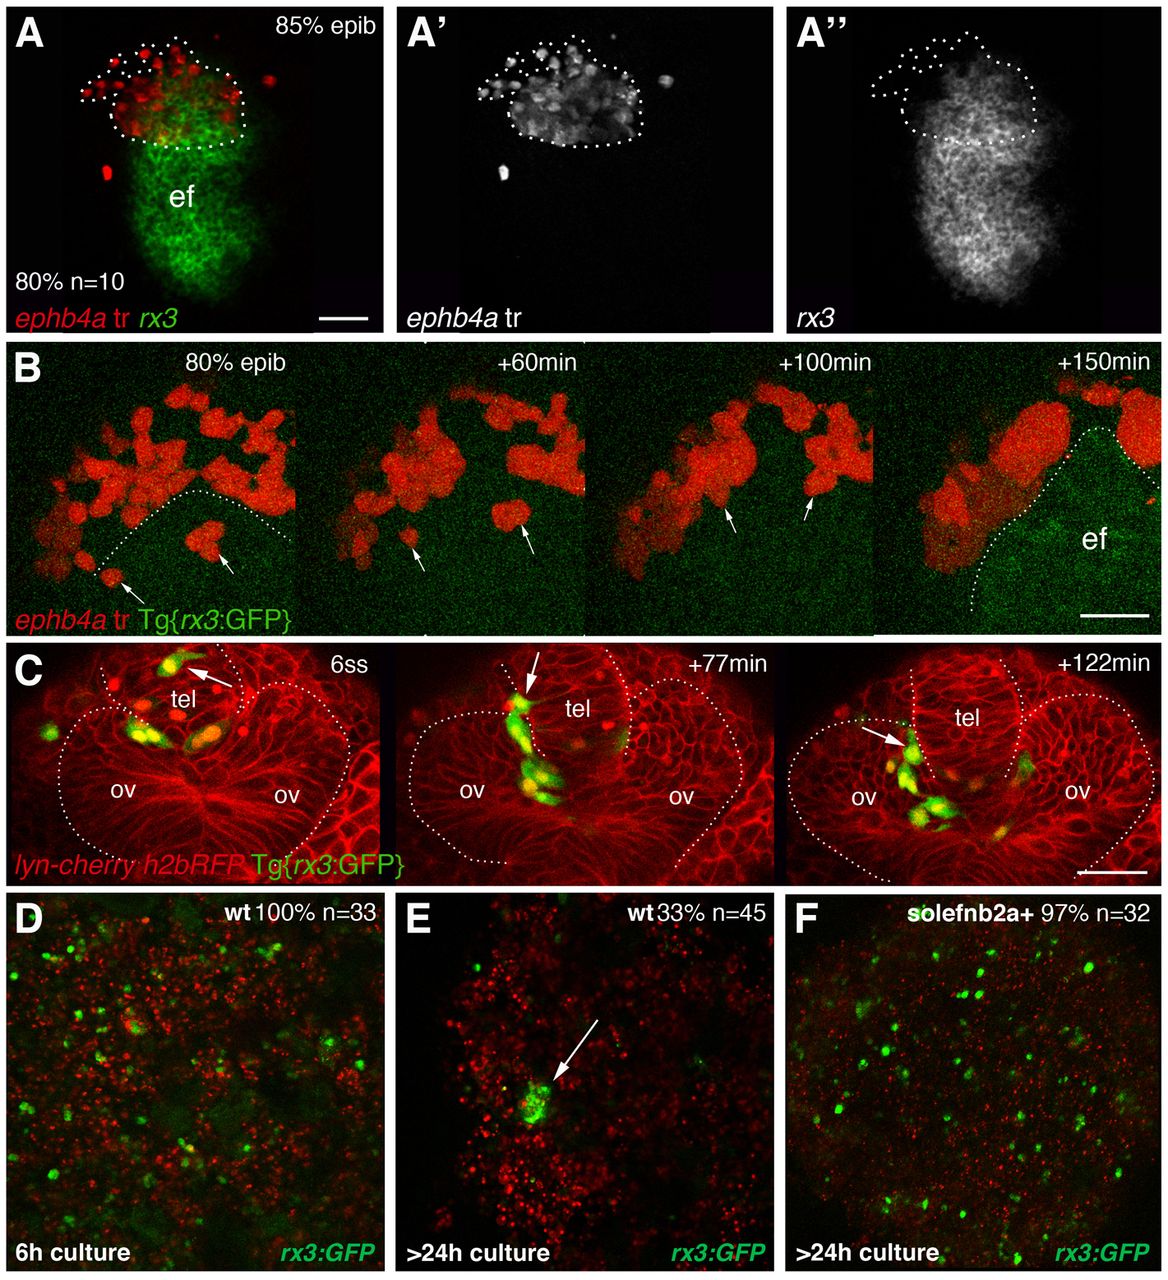
Fig. 7 Eye field cells actively segregate from cells in surrounding tissues. (A-A′) Dorsal view of the ANP with anterior to the left, showing a transplant of cells expressing ephb4a (red) straddling the eye/telencephalon domain at 80/90% epiboly. (B) Snapshots of the ANP with anterior to the top taken from supplementary material Movie 2, showing ephb4a+ cells (red, arrows) as they move out from the prospective eye field [labelled by GFP (green) and outlined in the last frame]. (C) Snapshots of the evaginating optic vesicles from a frontal view taken from supplementary material Movie 3, showing an rx3:GFP+ cell mislocated in the telencephalon (arrow) as it relocates into the optic vesicle. The host embryo has been counterlabelled by a membrane-tagged form of cherry (red) and the transplanted cells have their nuclei labelled by H2bRFP (red). (D-F) Confocal images of hanging drop cultures of cells obtained from the dissociation of Tg{rx3:GFP} tailbud stage embryos, cultured for 6 hours (D) or more than 24 hours (E,F). Eye field cells from non-manipulated embryos aggregated in small clusters after long culture times (E, arrow), whereas overexpression of sol-efnb2a results in virtually no embryos forming eye field cell aggregates (F). ef, eye field; ov, optic vesicle. Scale bars: 50 μm.
Image
Figure Caption
Acknowledgments
This image is the copyrighted work of the attributed author or publisher, and
ZFIN has permission only to display this image to its users.
Additional permissions should be obtained from the applicable author or publisher of the image.
Full text @ Development

