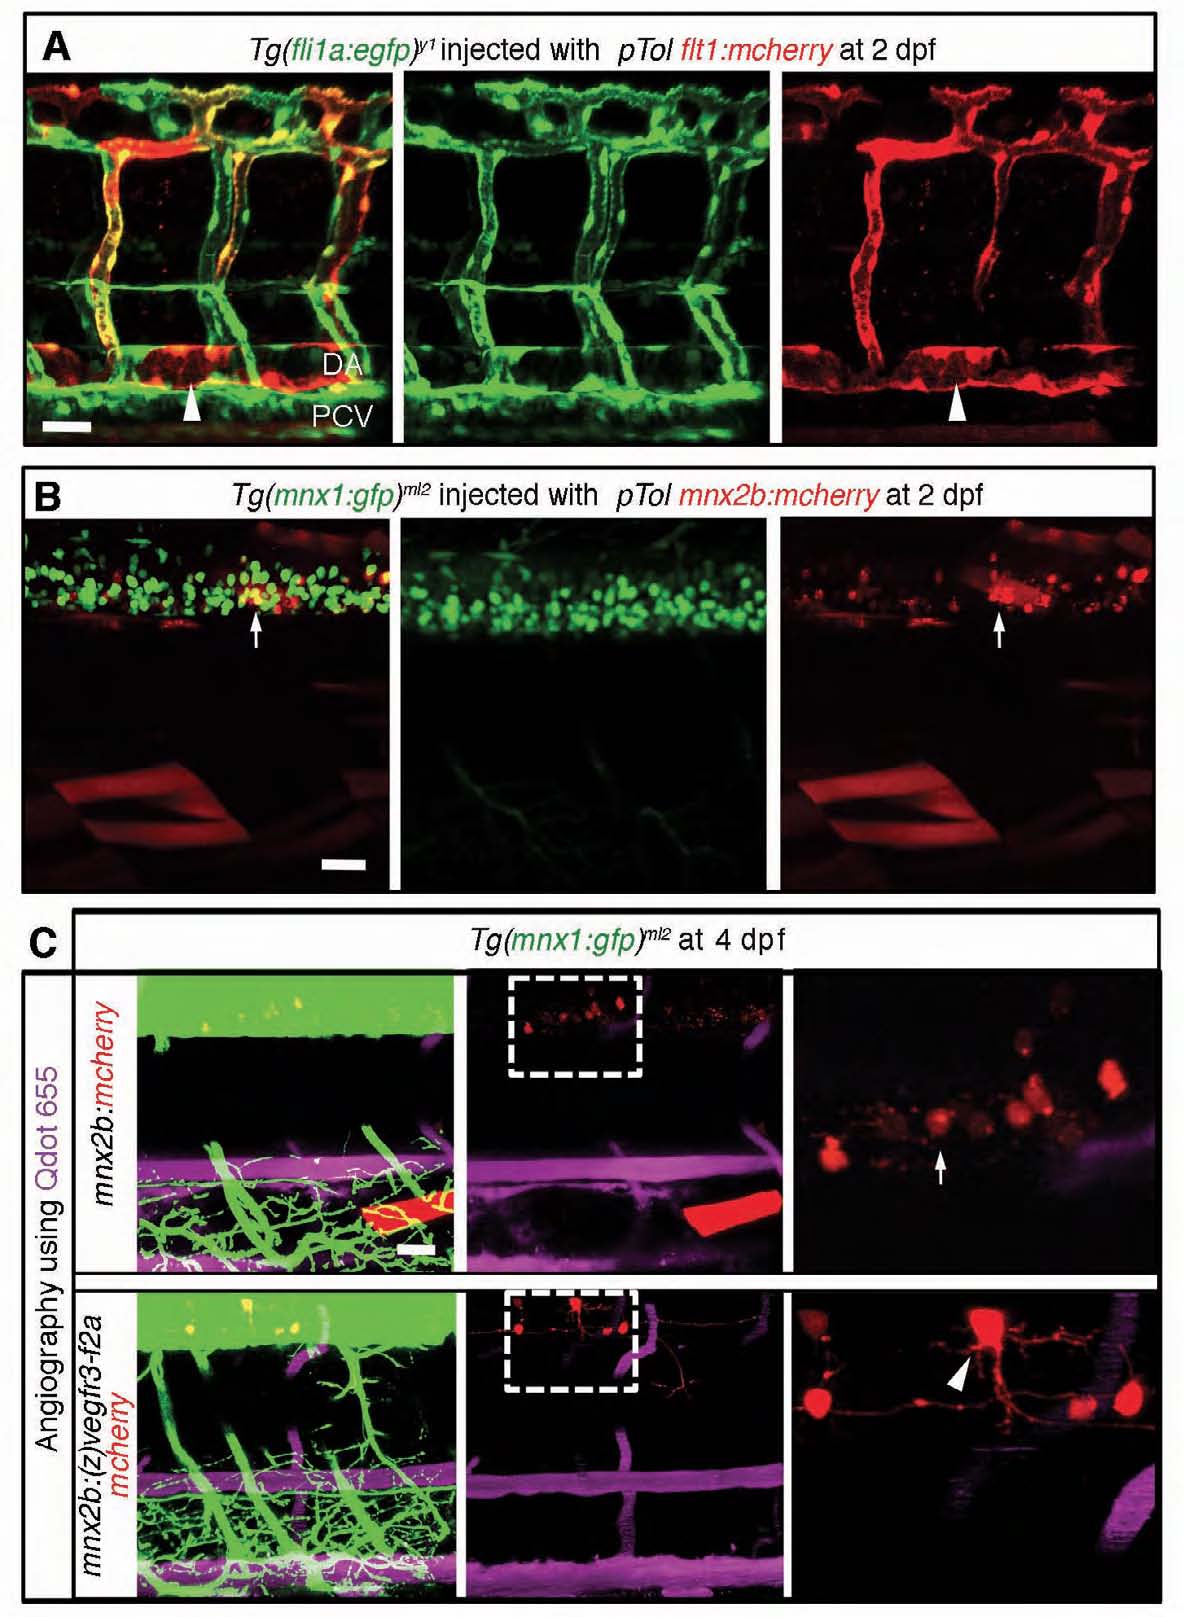
Fig. S4 Tissue-specific expression of genes driven by the flt1 and the mnx2b promoter used for Tol2-mediated gene transfer. (A,B) 3D-rendered confocal stack of fluorescence images (lateral view) of a Tg(fli1a:egfp)y1 embryo (2 dpf) injected with pTol flt1:mcherry plasmid (A) and of a Tg(mnx1:gfp)ml2 embryo (2 dpf) injected with pTol mnx2b:mcherry plasmid (B). Arrowheads indicate the expression of mCherry in the DA (A). Arrows indicate the expression of mCherry in motoneurons (B). DA, dorsal aorta; PCV, posterior cardinal vein. Note that mCherry is observed in the DA and arterial intersegmental vessels but not in the PCV in A. (C) 3D-rendered confocal stack images (lateral view) of Tg(mnx1:gfp)ml2 embryos transiently expressing the molecules indicated at the left. The embryos were injected with Quantum (Q) dot 655 into the blood vessels at 4 dpf. Left panels, merged images of GFP, mCherry and Qdot 655 images; center panels, merged images of mCherry and Qdot 655 images; right panels, enlarged image of boxed region of the center panels. Arrow and arrowhead indicate expression of mCherry in the motoneurons. Scale bars: 25 μm.
Image
Figure Caption
Acknowledgments
This image is the copyrighted work of the attributed author or publisher, and
ZFIN has permission only to display this image to its users.
Additional permissions should be obtained from the applicable author or publisher of the image.
Full text @ Development

