Fig. 1
Dynamic Nature of Thymus Homing
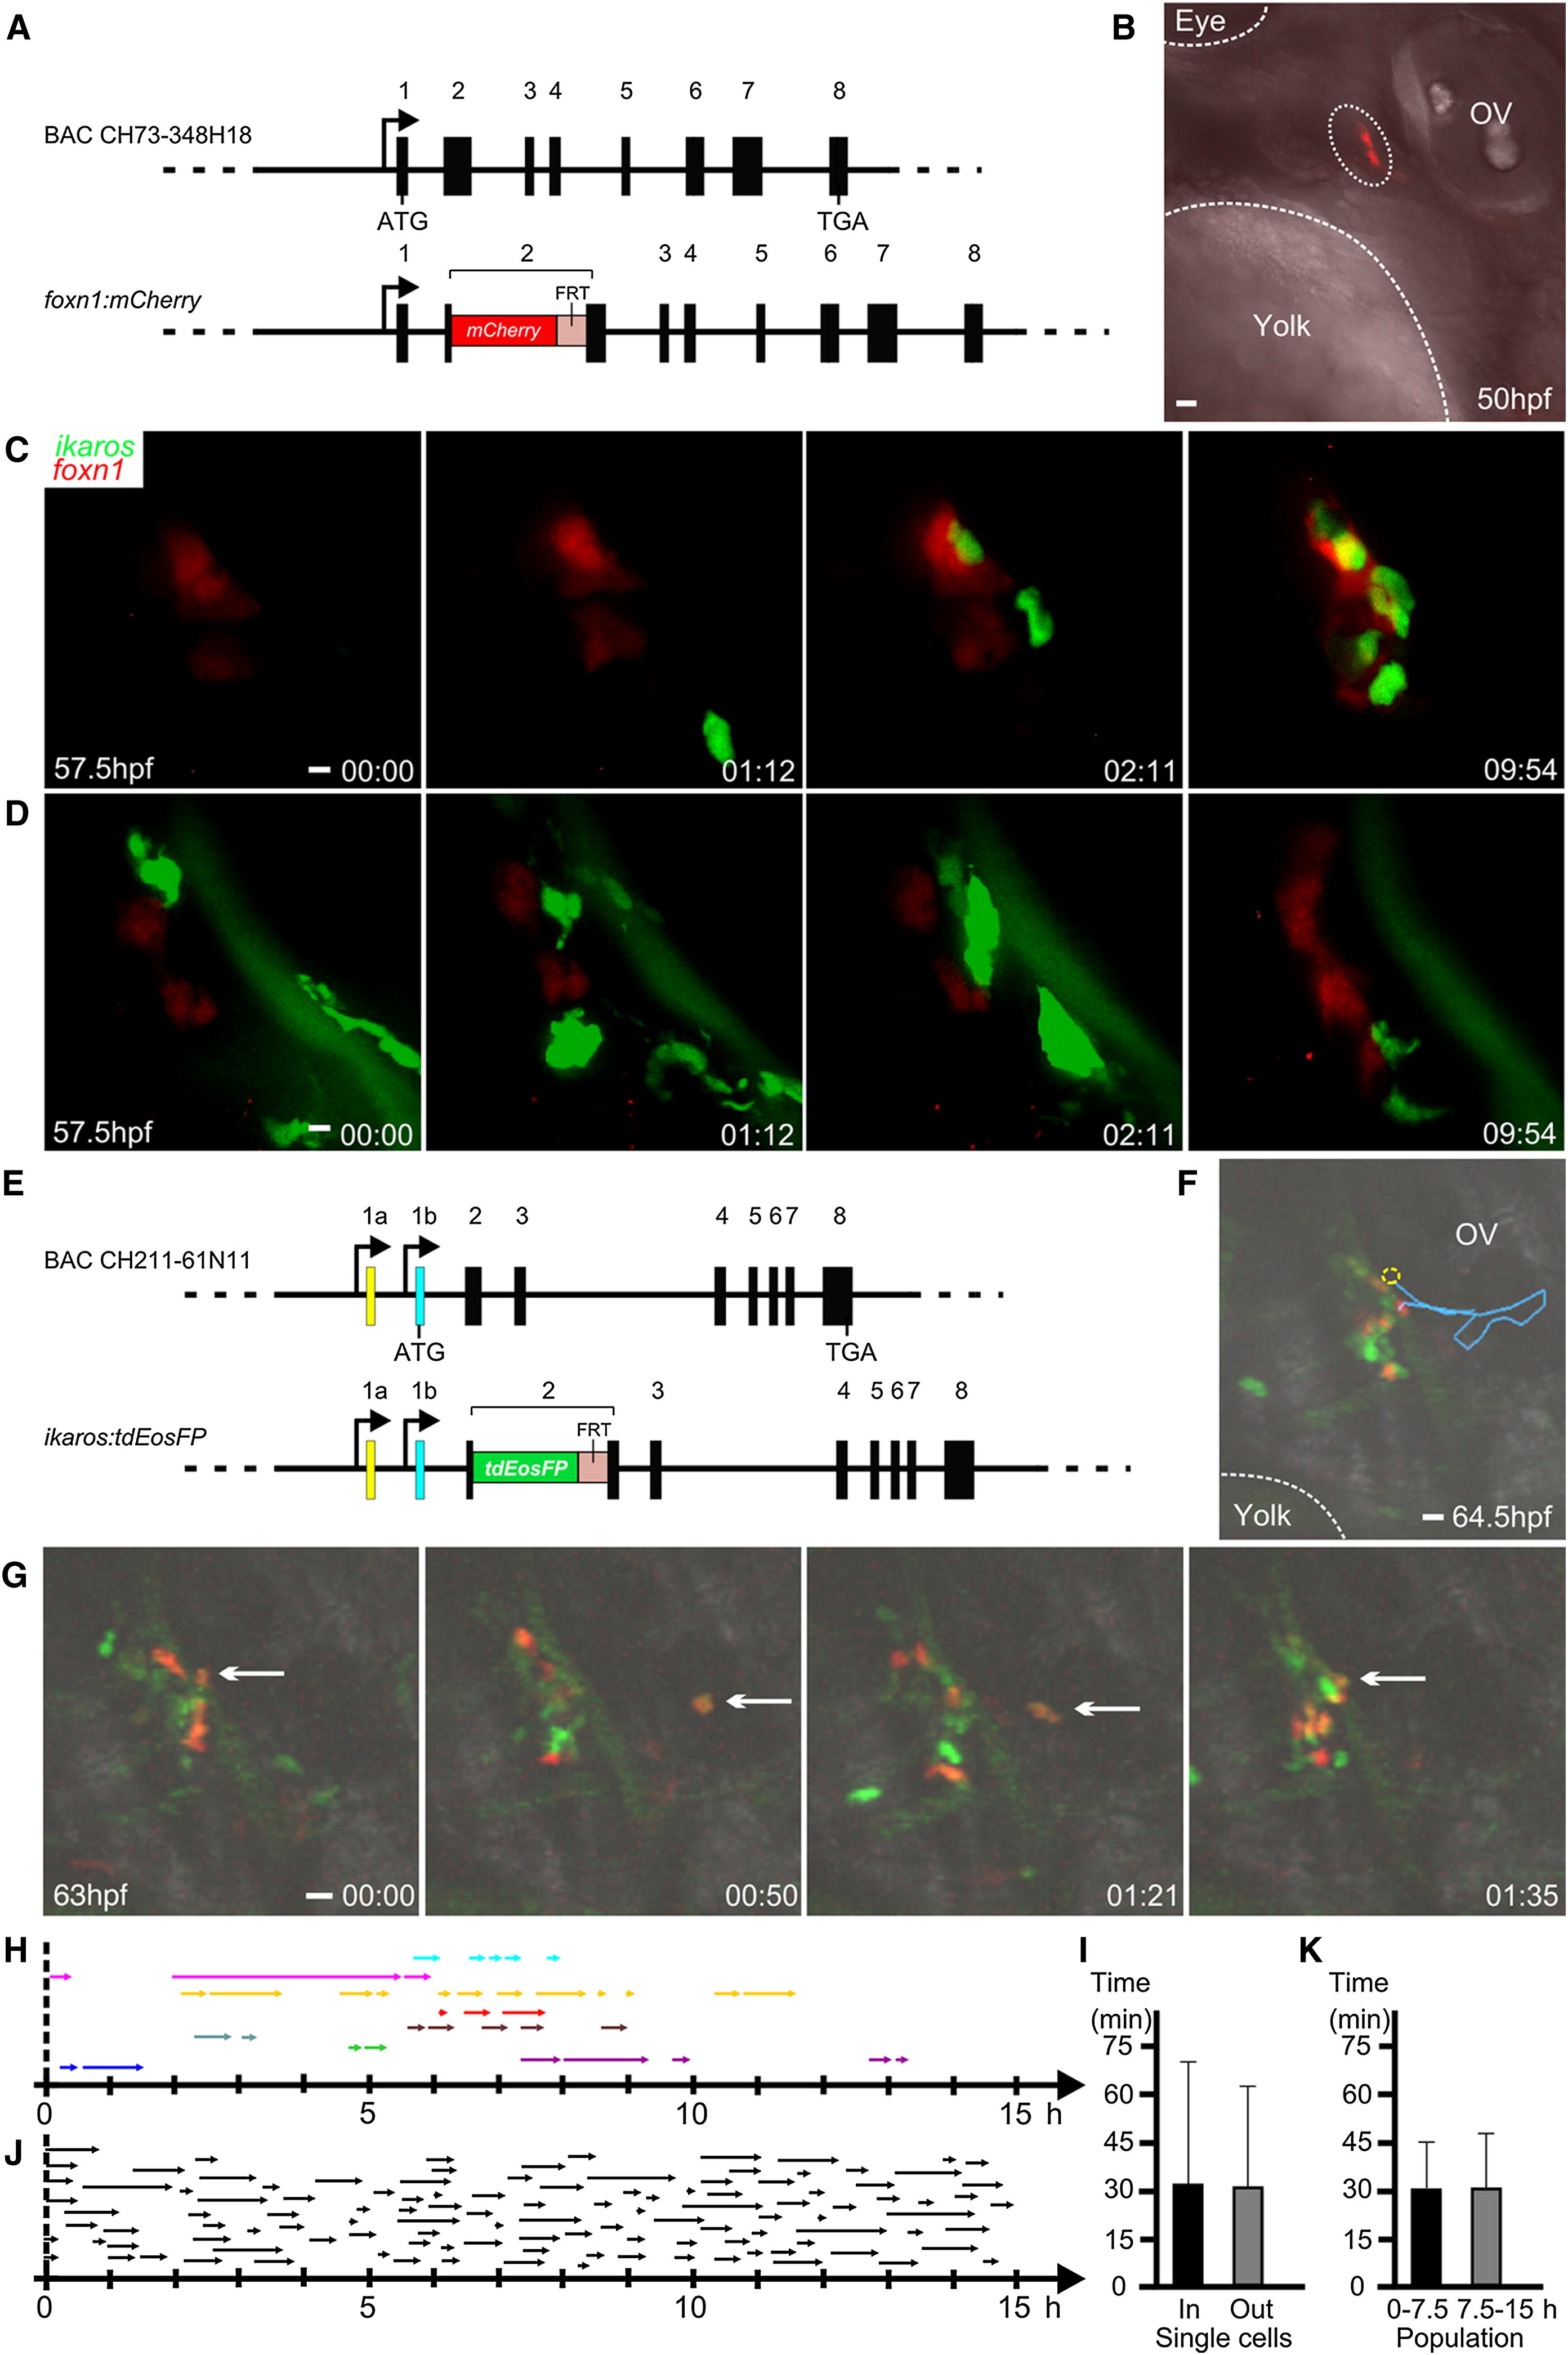
(A) Schematic of the transgenic construct to direct expression of mCherry to thymic epithelial cells. The mCherry cDNA was inserted in-frame into the second coding exon of the foxn1 gene via homologous recombination in bacteria of a BAC spanning the entire foxn1 gene and extending into flanking genes.
(B) The thymic epithelial anlage (encircled by dotted line) exhibits red fluorescence in foxn1:mCherry transgenic fish. Major anatomical landmarks are highlighted; ov, otic vesicle. The photograph was taken at 50 hpf, before the colonization of the thymic rudiment by lymphocyte progenitors. Photograph representative of four embryos. Scale bar rerpresents 10 μm.
(C) Still photographs of a time-lapse recording of a representative double-transgenic wild-type embryo (ikaros:eGFP [green fluorescence]; foxn1:mCherry [red fluorescence]). The still series begins at 57.5 hpf (00 hr:00 min). Note the intimate contact between lymphoycte progenitors and thymic epithelium, particularly evident at 09:54. Representative results for 20 embryos. Scale bar represents 5 μm.
See also Movie S1.
(D) Still photographs of a time-lapse recording of a representative double-transgenic ikaros-/- mutant embryo (ikaros:eGFP [green fluorescence]; foxn1:mCherry [red fluorescence]). The still series begins at 57.5 hpf (00 hr:00 min). Note the presence of numerous myeloid cells that migrate across the perithymic field but do not make contact with the thymic epithelium. Representative results for 12 embryos. Scale bar represents 5 μm.
See also Movie S2.
(E) Schematic of the transgenic construct to direct expression of tdEosFP to hematopoietic progenitor cells. The tdEosFP cDNA was inserted in-frame into the second coding exon of the ikaros gene via homologous recombination in bacteria of a BAC spanning the entire locus (Bajoghli et al., 2009).
(F) Trajectory (blue line) of a thymus-settling cell exhibiting the characteristic in-out-in pattern of migration. Intrathymic cells were marked by photoconversion from green to red fluorescence; the selected cell leaves the thymus in the region indicated by the dotted circle and returns to the thymus after migration through the perithymic mesenchyme (end of blue line). Representative of 116 events. Scale bar represents 10 μm.
(G) Still photographs from a time-lapse recording illustrating the in-out-in pattern of migration as in (F). The still series begins at 63 hpf (00 hr:00 min); arrows mark the same cell in all frames. Scale bar represents 10 μm.
See also Movie S3.
(H) Characteristics of in-out-in migration. Patterns were recorded for single cells (n = 9); each cell is indicated by a different color and periods in extrathymic tissues are indicated by arrows.
(I) Distribution of extrathymic and intrathymic residence times for single cells shown in (H) (mean ± SD).
(J) Extrathymic residence times for 116 events over a period of 15 hr; 0 denotes 57.5 hpf, as the starting point for the recording. Data pooled from observation of 16 embryos.
(K) Quantitative analysis of data in (J). Extrathymic residence times for two consecutive 7.5 hr periods are shown (mean ± SD).
Reprinted from Immunity, 36(2), Hess, I., and Boehm, T., Intravital Imaging of Thymopoiesis Reveals Dynamic Lympho-Epithelial Interactions, 298-309, Copyright (2012) with permission from Elsevier. Full text @ Immunity

