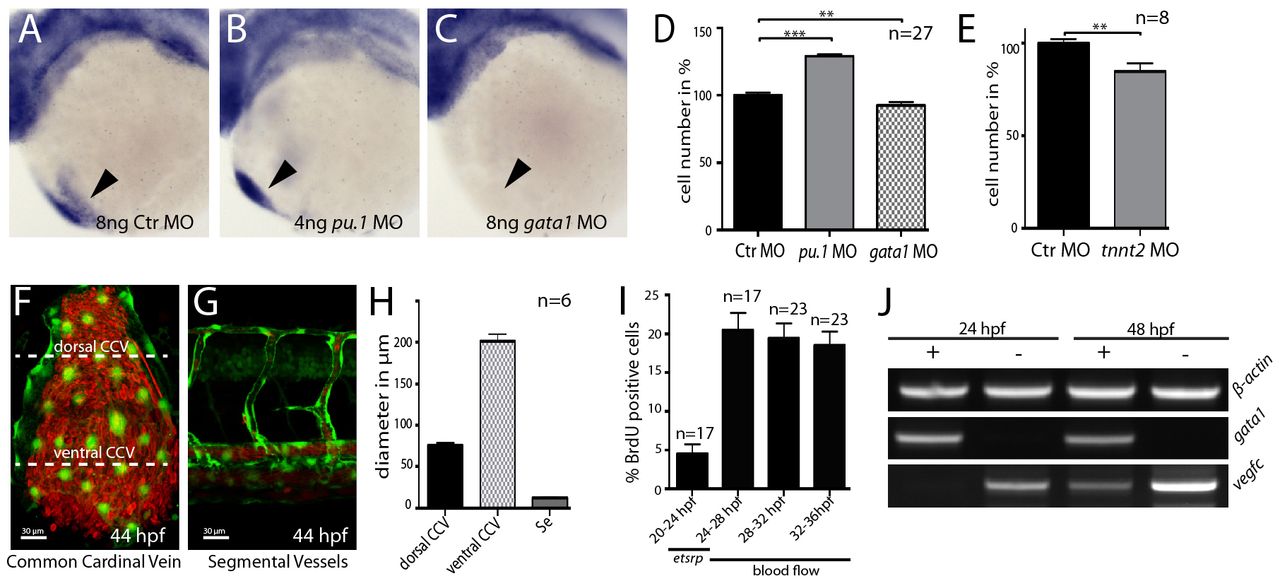
Fig. 8 Vegfc expressed from erythrocytes regulates EC numbers in the CCV. (A-C) Expression of vegfc in the region of the heart (arrows) in embryos injected with control MO (A), pu.1 MO (B) or gata1 MO (C) detected by in situ hybridization at 32 hpf; lateral views. (D,E) Quantification of EC numbers in the CCVs at 32 hpf (D) and 48 hpf (E). The number of ECs increased in embryos lacking macrophages (pu.1 MO-injected, D) and decreased in embryos lacking erythrocytes (gata1 MO-injected, D) or blood flow (tnnt2a MO-injected, E). (F-H) Confocal projections of Tg(etsrp:EGFP)ci1 CCV (F) and intersegmental vessel (Se) (G) at 44 hpf (lateral views) and comparison of the lumen diameter (H). The lumen diameter in the dorsal CCV is seven times larger and in the ventral CCV 20 times larger than that of the intersegmental vessel. Scale bars: 30 μm. (I) ECs start to proliferate with the onset of circulation. Until 24 hpf, ECs in the CCV still express the angioblast marker etsrp and only 5% proliferate. With the onset of circulation, proliferation of CCV ECs increases to 20%. Embryos were pulsed with BrdU at the indicated time points. (J) RT-PCR analysis of erythrocytes isolated from Tg(gata1:DsRed)sd2 embryos at 24 hpf and 48 hpf. gata1:DsRed positive (+) and negative (-) cells were isolated by FACS and analyzed for β-actin, gata1 and vegfc expression. **P<0.01, ***P<0.001; error bars indicate s.e.m.
Image
Figure Caption
Figure Data
Acknowledgments
This image is the copyrighted work of the attributed author or publisher, and
ZFIN has permission only to display this image to its users.
Additional permissions should be obtained from the applicable author or publisher of the image.
Full text @ Development

